
Most people shopping for a LinkedIn analytics tool do not have a tooling problem. They have a measurement problem: impressions climb, a dashboard gets paid for, and the thing that actually compounds on LinkedIn goes unmeasured. This guide compares the real categories of LinkedIn analytics tool, starting with LinkedIn's own free analytics, and is honest about what each one cannot tell you. It is for founders, consultants and small teams who post and comment themselves.
Key takeaways
- LinkedIn's native analytics are free and genuinely good for the basics. Only pay when you hit a wall you can name.
- Impressions measure delivery, not interest. Engagement rate is the number that tells you whether the idea actually landed.
- Almost no analytics tool measures your commenting, where most compounding distribution comes from.
- Third-party tools fall into four honest categories, and the right one depends on how many accounts you run, not on which brand is trending.
- Any number in a product screenshot, ours included, is demo data. The point of analytics is to find the answer for your audience, not inherit somebody else's.
- Pick the smallest tool that changes what you do next week. A dashboard you never act on is a subscription, not a strategy.
- Prices are not comparable across vendors: some bill per seat, some per channel, some per profile.
Start with the metric, not the tool
Almost every "best LinkedIn analytics tools" article is a list of products with feature bullets. That ordering is backwards: if you do not know which number you are trying to move, a better dashboard only gives you more numbers to feel vaguely good or bad about. Get precise about the headline metrics first, because most people use them interchangeably and optimise for the wrong one.
| Metric | What it actually tells you | How it misleads | What to decide with it |
|---|---|---|---|
| Impressions | How many times your post was rendered on somebody's screen | Counts the same person more than once, and a fast scroll past counts | Whether LinkedIn distributed the post at all |
| Reach or unique views | Roughly how many distinct people saw it | Not always exposed at post level, so people substitute impressions and overcount | Whether you are reaching new people or recycling the same circle |
| Engagement rate | What share of the people who saw it did something | A small post with three friendly comments can out-rate a strong post that reached thousands | Whether the idea landed, once you control for how far it travelled |
| Comments | How many people were willing to type in public with their real name attached | Inflated by "great post" replies that carry no signal | Which topics are worth writing about again |
| Profile views | How many people were curious enough to go look at who you are | Lags your posting by days, and is driven as much by commenting as by posting | Whether your content is making people investigate you |
The hierarchy is simple. Impressions tell you the algorithm gave you a shot. Engagement rate tells you what you did with it. Comments and profile views tell you whether anything happened as a result. Followers tell you almost nothing, which is why most tools put them in the biggest font.
For the arithmetic rather than the theory, we work through three engagement rate formulas in how to calculate LinkedIn engagement rate, and make the case against the pretty numbers in vanity metrics versus authenticity on LinkedIn.
LinkedIn's own analytics: free, and better than most people think
Before paying anyone, use what you already have. LinkedIn's Analytics and tools page gives personal profiles post-level impressions, engagement, follower and visitor demographics, top content and search appearances. Company Pages add visitor analytics, competitor comparison and an export button.
For a solo founder posting three times a week, that is frequently enough. The honest limits are these:
- The history window is short and the date controls are inflexible, so you cannot easily compare this month against your own six months ago, which is the comparison that matters.
- Nothing in it measures your commenting, the single biggest blind spot in native analytics.
- Reporting is manual, so a client-ready PDF every month means living in the export button.
Every paid tool below exists to close one of those four gaps. Work out which gap is yours before you open a pricing page. Our longer walkthrough of the native dashboard is in the ultimate guide to LinkedIn analytics.
The five types of LinkedIn analytics tool
Ranking twelve products against each other is not useful, because they are not competing for the same job. Sorting them into categories is.
| Category | Representative tools | What it does well | What this category typically will not give you | Suits | Rough price band |
|---|---|---|---|---|---|
| LinkedIn native analytics | Creator analytics, Page analytics | Impressions, engagement, demographics, top posts, exports | Long history, benchmarking against your own past, any view of your commenting | Everyone, as the starting point | Free |
| Creator analytics apps | AuthoredUp, Taplio | Deep post history for a personal profile, engagement rate trends, content tagging | Company Page depth, ads data, other networks | Solo creators, founders, ghostwriters | Low monthly, usually per profile |
| Social media suites | Sprout Social, Hootsuite, Buffer | Cross-network reporting, scheduling, approvals, team workflow | LinkedIn-specific depth, especially for personal profiles | Marketing teams running several networks at once | High monthly, usually per seat |
| Agency reporting platforms | AgencyAnalytics, Swydo | Multi-client dashboards, white-label reports, organic and paid in one view | Guidance on what to publish next for any one person | Agencies that report to clients monthly | Mid to high monthly, often per client |
| Analytics inside your posting tool | LiGo Analytics | Your best times, days, formats and topics, asked in plain English | Competitor benchmarking and cross-network reporting | People who post and comment daily and want to act the same day | Low monthly |
The same decision as a picture:
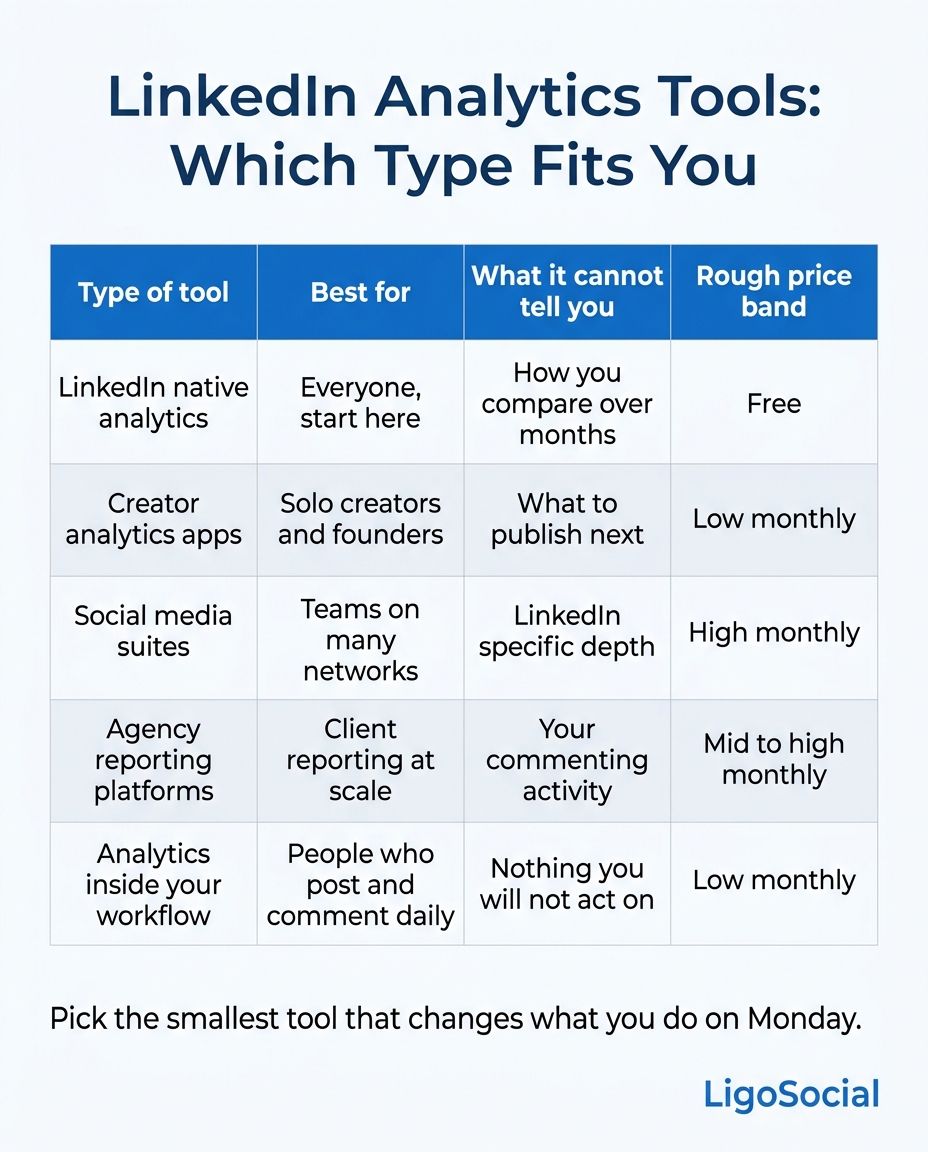
Read that middle column fairly: it describes the shape of a category, not a flaw in a named product. A cross-network suite is shallow on LinkedIn because it supports nine other networks, a fair trade for a team that needs all nine.
What these tools actually cost, and the trap in the price column
The headline price is rarely the bill, because no two vendors charge for the same unit. We checked each vendor's own pricing page on 13 August 2026. Monthly billing is shown so the numbers compare like for like, and annual billing is cheaper in every case.
| Tool | Entry price, monthly billing | What one unit of that price buys |
|---|---|---|
| Buffer | $6 per month | one channel, not one user |
| AuthoredUp | $19.95 per month | one LinkedIn profile |
| Taplio | $39 per month | one account |
| Sprout Social | $99 per month | one seat, capped at 5 social profiles |
| Socialinsider | $99 per month | one seat, up to 20 social accounts |
| Hootsuite | $99 per user per month | annual billing only, no monthly option shown |
| Brand24 | $249 per month | one user, 3 tracked keywords |
That unit column is the whole story. Buffer bills per channel, Sprout and Hootsuite per seat, AuthoredUp per LinkedIn profile, Brand24 and Socialinsider per plan with hard caps. A cheap-looking tool gets expensive at six client profiles, so price every option at the number of accounts you actually run.
One more reason to check dates rather than trust a listicle: Shield Analytics, still named in most roundups ranking today, has wound down, and its site now serves a shutdown notice rather than a product. If you are working out where to move, we covered the alternatives in this comparison.
The metric almost nobody tracks: comment-driven distribution
Here is the gap no category in that table closes. Every tool listed measures your posts. None measure the comments you leave on other people's posts, which for most individual accounts is where the compounding happens.
A post reaches whoever LinkedIn shows it to, which for a small account is mostly people who already follow you. A thoughtful comment on somebody else's post puts your name, your headline and a sample of your thinking in front of an audience that is not yours yet, at the moment they are already reading. Do that in the right rooms and your next post starts from a larger warm audience. Comments buy distribution with attention instead of money, which is why LiGo is built around a roughly 80% strategic commenting and 20% original posting split.
So the honest answer to "which analytics tool should I buy" is sometimes "none yet, go comment for a month first". Until a tool measures commenting properly, track it by hand: each week count the substantive comments you left and the profile views you got. Profile views respond to commenting faster than to posting, and a crude proxy you review beats a precise dashboard you do not.
Closing the loop: analytics that change what you do on Monday
Most analytics subscriptions get cancelled not because the data was wrong, but because reading it and acting on it happened in two different tools on two different days, and the second one stopped happening. LiGo Analytics is our attempt at closing that gap, and it is worth being specific rather than waving at "AI insights". It reads your real performance and reports the best times, days, formats and topics for your audience. Lookback windows are 7, 30, 90, 180 or 365 days, with 30 days as the default, and the smart posting-window recommendation uses a 180-day lookback and needs at least 10 posts before it commits to an answer. Data comes primarily from the LiGo Chrome Extension syncing your performance data, with a backfill from LinkedIn's API for posts published before you installed it. Instead of reading a chart you ask in plain English: "when do my posts perform best", "what topic should I write about again". There is a public demo if you want to see the shape of it without signing up.
One caution applies to every tool here, ours included: the figures in any product screenshot are sample data. Our own marketing dashboard shows a peak engagement window and a best-performing format, and those are illustrative demo values, not laws of LinkedIn. The right answer differs by audience, timezone and niche, which is the entire reason to run analytics. Treat any tool that hands you a universal best time to post with suspicion, including ours.
Two mechanisms close the loop the analytics feed. Because LiGo assumes growth is roughly 80% strategic commenting and 20% original posting, Engagement Lists turn any LinkedIn search into a one-click curated feed, and the comment co-pilot drafts six options inside the extension, three in your voice and three optimised, from which you pick and post one yourself. On the voice side, LiGo Brain is the memory layer trained per client profile with no cross contamination: it learns your tone, your recurring topics and the opinions you have already stated, and gets closer every time you edit what it hands back. Analytics tells you which topic landed. LiGo Brain keeps the follow-up sounding like you wrote it.
A 20-minute monthly analytics review you can copy
Whatever tool you land on, the review matters more than the dashboard. Here is the whole routine. It works with free native analytics.
- Open the last 30 days of post data.
- Sort by engagement rate, not impressions. Note your top three posts and your bottom three.
- For each, write one sentence on the topic and the format used.
- Look for the repeat. If two of your top three share a topic, that topic is next month's spine.
- Check profile views against your commenting volume for the same period. If commenting rose and profile views did not, you are commenting in the wrong rooms.
- Write down exactly one change for next month. One, not five.
If your tool has a plain-English query box, these are the questions worth asking rather than browsing charts:
Which posts in the last 90 days had the highest engagement rate, and what did they have in common?
Which topics declined over the last 90 days compared with the 90 days before?
Am I reaching new people, or the same people repeatedly?
That last question is the one most people never ask, and it usually explains a plateau.
How to choose in five minutes
Answer in order and stop at the first "yes".
- Posting fewer than twice a week? Native analytics. No tool helps until there is something to analyse.
- Need a client-ready report monthly? An agency reporting platform, priced per client.
- Running four or more networks with a team? A social media suite, accepting shallower LinkedIn depth.
- One or two personal profiles, and you want deep post history? A creator analytics app is the right size.
- Posting and commenting most days but never acting on the dashboard? Put the analytics inside the tool you post from.
There is no wrong answer, only a wrong size. The expensive mistake is buying a team-priced suite for one personal profile. The cheap one is never opening the free dashboard.
FAQ
How do I get LinkedIn analytics?
On a personal profile, open the Analytics section, or the Analytics and tools page from your profile menu, for post impressions, engagement, profile views and search appearances. On a Company Page you must be an admin, then use the Analytics tab for content, visitors, followers, leads and competitor views. Both are free, and Page analytics include an export button.
How does LinkedIn analytics work?
LinkedIn records each time your content is served to a member, plus any reaction, comment, repost or click that follows, and aggregates it against that member's profile data such as job title, industry and location. That is why demographics appear without you tagging anything. Two consequences matter: impressions count renders rather than readers, so one person can be counted twice, and demographic breakdowns are hidden when the audience is too small to anonymise.
What are the top LinkedIn analytics tools?
It depends on which of five categories you are in, not which brand is trending. LinkedIn's native analytics cover the basics for free. Creator analytics apps such as AuthoredUp and Taplio go deep on one personal profile, and note that Shield, still listed in most roundups, has wound down. Social media suites such as Sprout Social, Hootsuite and Buffer cover many networks for a team. Agency reporting platforms such as AgencyAnalytics and Swydo handle multi-client reporting. Tools with analytics inside the posting workflow, LiGo among them, suit people who want to act the same day. Pick the category first, then compare two products inside it.
Is posting 3 times a day on LinkedIn too much?
For almost everyone, yes. Three posts a day splits your own audience's attention across your own content, and the quality drop is usually visible by the second week. Two to five posts a week, with real commenting in between, is a workload most people sustain. For the answer for your account rather than a rule of thumb, check whether your engagement rate falls as your posting frequency rises. That relationship sits in your own analytics and differs for every audience.
What is the 95-5 rule on LinkedIn?
It is a business-to-business marketing idea popularised by the LinkedIn B2B Institute and the Ehrenberg-Bass Institute: at any moment only a small share of your potential buyers are in the market to buy, and the large majority are not. For analytics, that means lead counts from this month's posts will always understate the content's value, because most of the audience you reach is not buying yet. It argues for tracking whether the right people see and remember you, not just whether they filled in a form this week.
Where to go from here
Open your free LinkedIn analytics this week and run the review above. If you finish it thinking "I know what is working, but I still have to rebuild all of this by hand in another tab", that is the moment a tool earns its price.
At that point, LiGo Analytics puts the best times, days, formats and topics for your audience next to the place you actually write and comment, so insight and action are one click apart. You can try it with 100 free credits, enough to test for about 7 to 14 days, with no credit card.
LiGo is built by Ertiqah LLC. LinkedIn is a registered trademark of LinkedIn Corporation, and LigoSocial is not affiliated with, endorsed by, or sponsored by LinkedIn.