
What are impressions on LinkedIn? An impression is counted each time your post, comment or ad is shown on someone's screen. For Company Page content, LinkedIn counts it at 50 percent on screen for 300 milliseconds, or a click. Repeat displays count, so impressions measure how often you were seen, not how many people read you.
That one number sits at the top of every LinkedIn analytics screen, and it is the one people misread most. This guide gives you LinkedIn's own definitions for impressions, members reached, views and engagement rate, shows exactly where each number lives, and gives you a worksheet for judging what a "good" number is for your account, instead of someone else's.
Updated November 2026. Every definition below was checked against LinkedIn's Help Center this month.
Key takeaways
- Impressions = displays, not people. One person who scrolls past your post twice adds two impressions. LinkedIn calls its own count "an estimate."
- Members reached = distinct people. It never includes repeat views, so it is always equal to or lower than impressions.
- There is no "post views" metric on LinkedIn. "Views" means video views (2+ continuous seconds), article views or profile views. Each is a different number.
- Engagement rate is interactions divided by impressions. LinkedIn shows it for Company Page posts; for a personal profile you calculate it yourself.
- A "good" number is relative to your own baseline. Compare each post with the median of your last 15, not with a creator who has 100 times your followers.
What LinkedIn actually counts as an impression
LinkedIn defines impressions in a few places, and the wording differs slightly. Here is what each official help page says.
- Post analytics (personal profiles): impressions are the "number of times your post was shown on LinkedIn." (Post analytics for your content)
- Combined post analytics: "The number of times your post was displayed on screen. This number is an estimate and may not be precise." (Combined post analytics)
- Company Page content analytics: content highlights count views "when it's at least 50 percent on the screen" for "300 milliseconds or more, or when it's clicked." (Content analytics for your LinkedIn Page)
- Comments: "A comment impression is counted each time someone views your comment." The count is non-unique, and your own views are also counted. (View analytics for your comments)
Two things follow from those definitions, and most explainers skip both.
First, the 50 percent and 300 millisecond threshold is published for Company Page content, not for personal posts. It is widely repeated as the rule for every LinkedIn post, and personal posts may well use the same standard, but LinkedIn's member help pages only say "shown" or "displayed on screen." If someone quotes it as gospel for your personal profile, they are extrapolating. For context, the ad industry's viewability standard from the Media Rating Council is stricter: 50 percent of an ad's pixels in view for one continuous second for display, and two seconds for video (ANA summary of the MRC guidelines). LinkedIn's two-second rule for video views lines up with that video standard; its 300 millisecond rule for content is looser.
Second, an impression is a very low bar. A third of a second of half your post on a phone screen counts. That is why a post can show 3,000 impressions and 12 reactions without anything being wrong with LinkedIn's math. Many of those impressions were quick scrolls.
Organic vs paid impressions
Organic impressions come from the feed showing your post for free. Paid impressions come from ads and boosted posts. LinkedIn keeps them apart: ad impressions are reported in Campaign Manager, and a boosted post's analytics add a separate ad spend and performance section. When you compare posts, compare organic with organic, or a boost will make an ordinary post look like a breakout.
The three things that inflate or deflate the number
- Repeat displays. Someone who sees your post in the morning and again after lunch adds two impressions and one member reached.
- Your own activity. LinkedIn's comment help page says your own views count toward comment impressions. It does not make the same statement for posts, so do not assume either way. Just do not refresh your own post 20 times and treat the number as audience demand.
- Estimation. LinkedIn labels impressions and members reached as estimates. Small differences between the app, desktop and a third-party tool are normal and not worth chasing.
Impressions vs members reached vs views vs engagement rate
Impressions count every display of your post, members reached counts the distinct people behind those displays, and views, engagements and engagement rate measure what people did once they saw it. This is the table to bookmark. Every definition below is quoted or paraphrased from LinkedIn's help pages linked above, with no third-party metrics mixed in.
| Metric | LinkedIn's definition | Counts repeats? | Where it appears | What it tells you |
|---|---|---|---|---|
| Impressions | Times your post was shown or displayed on screen (an estimate) | Yes | Every post, creator analytics, Page analytics | How much the feed showed you |
| Members reached | Distinct members and Pages that saw your post; repeat views not counted (Campaign Manager calls the ad equivalent reach) | No | Post analytics, combined post analytics | How many different people you were in front of |
| In network / out of network | Share of impressions from people who follow or are connected to you, versus people who are not | n/a (a percentage) | Post analytics | Whether the post traveled beyond your existing audience |
| Engagements | Reactions, comments, saves, sends and reposts combined | Yes | Combined post analytics | Total actions people took |
| Engagement rate | For Pages, "the ratio of interactions per impressions," where interactions are clicks, reactions, comments and shares | n/a (a ratio) | Company Page content analytics; calculate it yourself for a profile | How persuasive the post was per display |
| Video views | Times your video was watched for two or more continuous seconds, including replays | Yes | Video post analytics | How many plays got past the scroll |
| Article views | Times your article was seen on LinkedIn or via email | Yes | Article and newsletter analytics | Long-form readership |
| Comment impressions | Each time someone views your comment; your own views count | Yes | Under your own comment (visible only to you) | How far a single comment traveled |
| Profile viewers from this post | Distinct members and Page admins who viewed your profile from the post | No | Post analytics | Whether the post made people curious about you |
| Followers gained from this post | Members who followed you from the post | No | Post analytics | Whether the post earned a lasting audience |
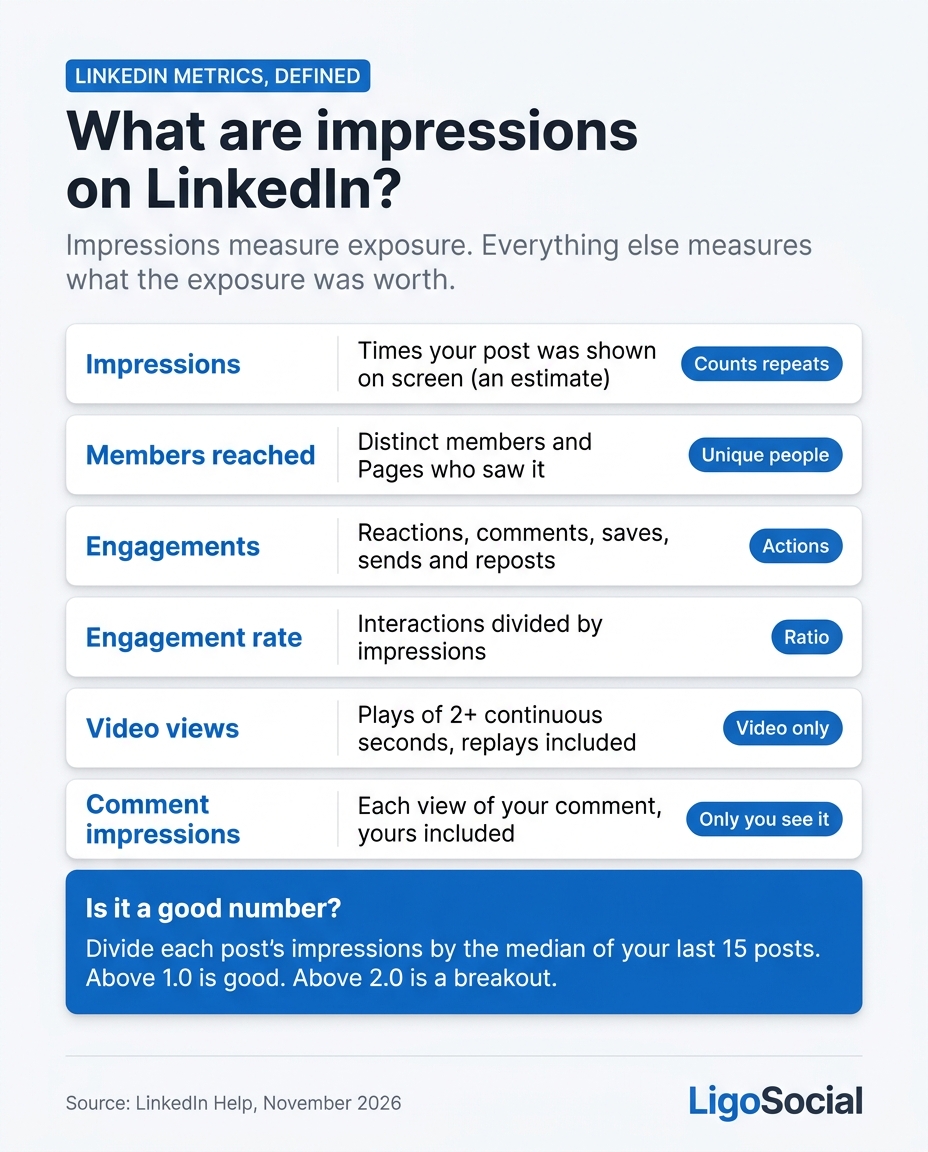
The quick way to remember it: impressions measure exposure, members reached measures audience size, and everything below those two rows measures what the exposure was worth.
For the full engagement rate formulas (by impressions, by followers, and by reach) and a worked example, use our guide on how to calculate LinkedIn engagement rate. We will not repeat it here.
Impressions vs views on LinkedIn: why the words get mixed up
People search "impressions vs views LinkedIn" because other platforms use "views" for the headline number. LinkedIn does not. On a text or image post, there is no metric called "views." You get impressions and members reached.
"Views" on LinkedIn always means one of three specific things:
- Video views: a play of two or more continuous seconds, replays included. A video can have 10,000 impressions and 1,800 views, because most people never let it play for two seconds.
- Article views: a LinkedIn article or newsletter edition seen on LinkedIn or opened via email.
- Profile views: people who opened your profile, reported separately (and for a post, as "Profile viewers from this post").
So if a client or manager asks "how many views did that post get," the honest answer for a text or image post is the members reached number, and you should say that is what you are quoting.
Where to find each number in LinkedIn analytics
Every post-level number lives behind the "[Number] impressions" link under your post, creator-level trends live in the Analytics section of your profile, and Company Page numbers live in the Page's admin Analytics tab. All of these paths come from LinkedIn's help pages as of November 2026. Only you can see your own post analytics.
Analytics for a single post (desktop)
- Click the Me icon at the top of your LinkedIn homepage.
- Under Manage, click Posts & Activity.
- Choose the Posts, Videos, Images, Articles or Newsletter tab.
- Click [Number] impressions in the lower-left corner of the post, or View analytics in the lower-right corner.
Source: View post analytics for your content.
Analytics for a single post (mobile app)
- Tap your profile photo in the upper-left corner, then your Profile card.
- Scroll to Activity and tap Show all posts.
- Pick the content tab, then tap [Number] impressions in the lower-left corner of the post.
Creator analytics across all your posts
- Click Me, then your Profile card.
- Scroll to the Analytics section and click Show all.
- Use the dropdown to switch between Impressions and Engagements over time.
Source: View your creator analytics.
Company Page post analytics
Open your Page in admin view, go to Analytics, then Content. This is where the engagement rate, clicks and click-through rate live. Definitions: Content analytics for your LinkedIn Page.
Comment impressions
There is no dashboard for these. The impression count sits under each comment you leave, visible only to you. Our LinkedIn comment impressions guide covers how to use that number to choose which posts are worth commenting on.
How long LinkedIn keeps the data
This catches people who try to review a full year of posts. Per LinkedIn's post analytics page, discovery and engagement counts are kept for 1,000 days, members reached for 400 days, demographic breakdowns for 180 days, and video analytics for 365 days. If you want year-over-year comparisons, export or record your numbers before they age out.
Here is the whole metric map on one page, so you can keep it next to your analytics tab.
What is a good number of impressions on LinkedIn?
There is no universal good number, and anyone who gives you one without asking your follower count, niche and posting frequency is guessing. A post with 800 impressions is a strong result for a consultant with 600 followers and a weak one for a creator with 60,000.
The only published benchmark we would quote with a straight face covers Company Pages, not personal profiles. Socialinsider's LinkedIn 2026 benchmarks put average impressions per post for Pages with 1,000 to 5,000 followers between 235 (link posts) and 525 (native document posts), and for Pages with 10,000 to 50,000 followers between 340 (link posts) and 1,850 (multi-image posts). Personal-profile ranges you see online rarely name a study, a sample or a date.
So build your own benchmark. It takes about 15 minutes and it is the only number that tells you whether a post did well for you.
The 15-post baseline worksheet
Copy this into a spreadsheet. One row per post, your last 15 posts, newest at the top.
| Column | What to enter | Where it comes from |
|---|---|---|
| A: Date | Post date | Posts & Activity |
| B: Format | Text, image, document, video, poll | The post itself |
| C: Impressions | The impressions number | Post analytics |
| D: Members reached | The members reached number | Post analytics |
| E: Out of network % | The out of network percentage | Post analytics |
| F: Engagements | Reactions + comments + reposts + saves + sends | Post analytics |
| G: Engagement rate | =F2/C2 |
Formula |
| H: vs median | =C2/MEDIAN($C$2:$C$16) |
Formula |
Then read it with four rules:
- Your median is your "normal". Use
=MEDIAN(C2:C16), not the average. One post that went wide will drag an average up and make every other post look like a failure. - Above 1.0 in column H is a good post. Above 2.0 is a breakout. Those are the posts to study: format, topic, hook, time of day.
- Watch out-of-network percentage on your best posts. A breakout with a high out-of-network share means the feed pushed you to new people. A breakout that stayed in network means your existing audience loved it, which is a different (and also useful) signal.
- Compare members reached with impressions. If members reached is far below impressions, the same people saw the post repeatedly. That usually means a small, engaged circle, not broad distribution.
A realistic example: say your median is 1,100 impressions. A document post hits 2,600 impressions with 1,900 members reached and 41 percent out of network. That post scores 2.4 in column H and traveled well beyond your connections. That is the format and topic to repeat next week, not the text post that got more likes from colleagues.
Judge every post against your own median, not against someone else's screenshot.
If you would rather not rebuild this spreadsheet every month, LiGo Analytics does the same comparison from your real LinkedIn data, and you can ask it plain-English questions such as "which formats get me the most impressions?" or "when do my posts perform best?" instead of reading charts. Post Lab's Repurpose Radar agent then picks up the other half of the job: it surfaces your posts from 60+ days ago that performed well above your average and drafts a fresh angle on each, so a breakout gets a second life instead of disappearing.
Why your impressions changed (and what to check first)
When impressions drop or spike, people blame "the algorithm" first. Check these in order instead.
| What you see | Most likely cause | What to check |
|---|---|---|
| Impressions dropped on one post | Weaker hook or format than usual | Column H in your worksheet: is it a one-off or a trend? |
| Impressions dropped across two or more weeks | Posting less often, or a format your audience skips | Posting dates and format column |
| High impressions, very few reactions | Shown widely, but the first lines did not stop the scroll | Your opening two lines |
| High impressions, low members reached | Same people seeing it repeatedly | Out-of-network % (likely low) |
| Spike from one post | A repost, a strong comment thread, or a timely topic | Reposts count and out-of-network % |
Our breakdown of the LinkedIn algorithm in 2026 covers what the feed rewards this year. Timing also moves impressions, so test your own slots instead of trusting a generic chart (here is why most best-time-to-post advice is wrong).
Impressions are an input, not the goal
Impressions tell you the feed gave you a chance. They do not tell you whether the right people saw it or whether anything happened next. For founders, consultants and agency owners, the numbers that pay the bills sit lower in the post analytics screen: profile viewers from this post, followers gained from this post, and the conversations that start in comments and DMs.
That is also why comments matter so much. A thoughtful comment on a post your ideal client is reading earns its own impressions, in front of an audience you did not have to build. Track profile viewers after a week of steady commenting to see whether it pays off for you. The LiGo Chrome extension drafts comments in your own voice while you browse, and you post after reviewing.
For the wider measurement picture, from follower growth to inbound leads, read our complete guide to LinkedIn analytics.
Frequently asked questions
How many impressions is a good post on LinkedIn?
A good post beats the median impressions of your own last 15 posts, and a breakout doubles it. There is no universal number because follower count, niche and format change the baseline. For Company Pages, Socialinsider's 2026 benchmarks put averages for 1,000 to 5,000 follower Pages at roughly 235 to 525 impressions per post depending on format.
Are LinkedIn impressions the same as reach?
No. Impressions count every time your post is displayed, including repeat displays to the same person. Reach, which LinkedIn calls members reached, counts distinct members and Pages, with repeat views excluded. Members reached is always equal to or lower than impressions.
Which is better, reach or impressions?
Members reached is the better measure of audience size, because it counts people rather than displays. Impressions are better for spotting distribution changes over time and are the denominator for engagement rate. Track both: a big gap between them means the same people are seeing your post repeatedly.
Are impressions better than views on LinkedIn?
They measure different things. Impressions count any time content is shown on screen. Views on LinkedIn are stricter and specific to a format: a video view needs two or more continuous seconds of play, and an article view means the article was opened on LinkedIn or via email. Text and image posts have no views metric at all.
What is the 3/2/1 rule on LinkedIn?
It is not a LinkedIn rule, metric or setting, and LinkedIn's help pages do not mention it. Different creators use the name for different posting or engagement routines, so there is no single definition. If you follow one, measure it against your own impression baseline like any other tactic.
How much is a LinkedIn impression worth?
Organic impressions have no official dollar value. LinkedIn only prices impressions for ads, where advertisers bid in Campaign Manager and the cost depends on targeting and competition. For organic posts, value comes from what an impression leads to: profile views, followers gained, comments and conversations.
Make the number mean something
Impressions are LinkedIn's count of how often your content was on someone's screen. Members reached tells you how many different people that was. Views, engagements and engagement rate tell you whether any of it landed. Build the 15-post baseline once, judge every new post against your own median, and spend your energy on the formats and comment conversations that move profile views.
When you want that comparison done for you, LiGo Analytics shows your best formats, days and times from your own LinkedIn data and answers questions in plain English. You can see how it works first on the live analytics demo, no login needed.