
LigoSocial Research/Statistics
LinkedIn statistics: platform numbers and what 134,522 real posts show
LinkedIn has more than 1.3 billion members and grew revenue 12% in the quarter to June 2026. For the people posting on it, the statistics that matter are smaller: the typical post earns 10 reactions, comments and reposts, a 0.32% engagement rate, and posts that read as AI get 21% less engagement than the same author's other posts.

By Junaid KhalidLinkedIn strategist, LigoSocial Research
Sample134,522 posts from 1,499 real LinkedIn profiles (January 2023 to September 2026) and 5,530 posts from 200 company pages (January 2025 to September 2026), plus LinkedIn, Microsoft and Pew figures
- LinkedIn members
- 1.3B+
- LinkedIn members
- LinkedIn, October 2026
- Engagements on the typical post
- 10
- Engagements on the typical post
- reactions, comments and reposts
- Typical engagement rate
- 0.32%
- Typical engagement rate
- engagement divided by followers
- Engagement on posts that read as AI
- -21%
- Engagement on posts that read as AI
- vs the same author's other posts
Key findings
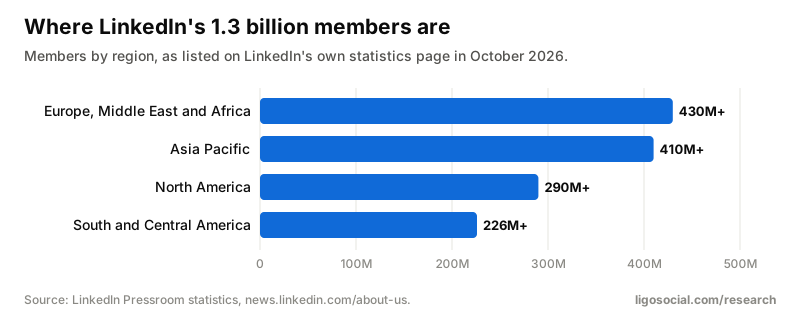
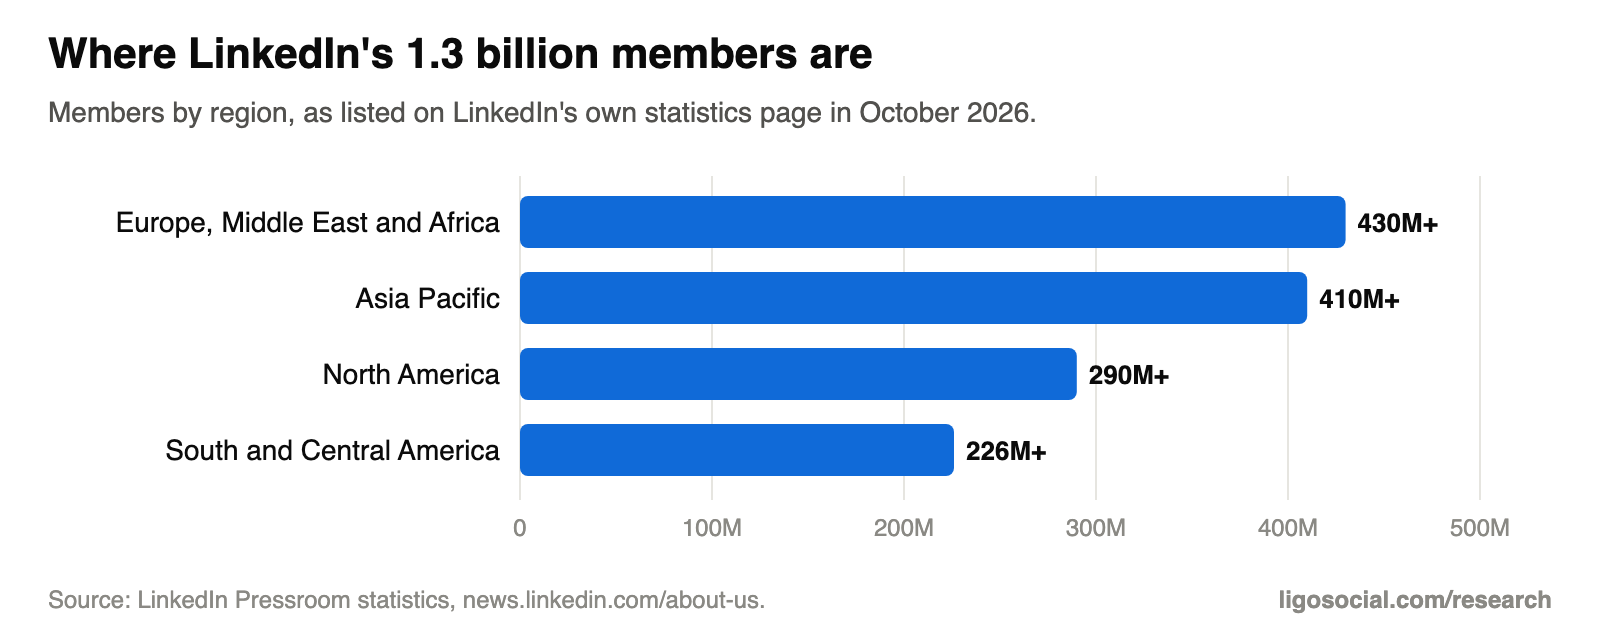
- More than 1.3 billion members. Europe, the Middle East and Africa (430 million+) and Asia Pacific (410 million+) are the largest regions, and LinkedIn revenue grew 12% year on year in the quarter to June 2026.
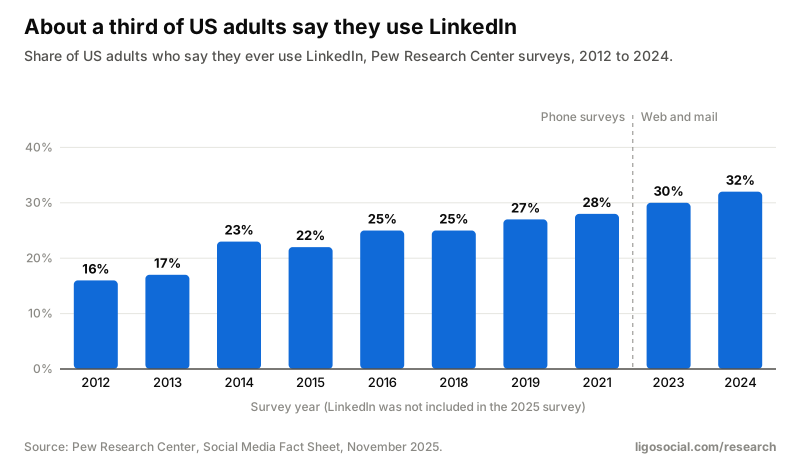
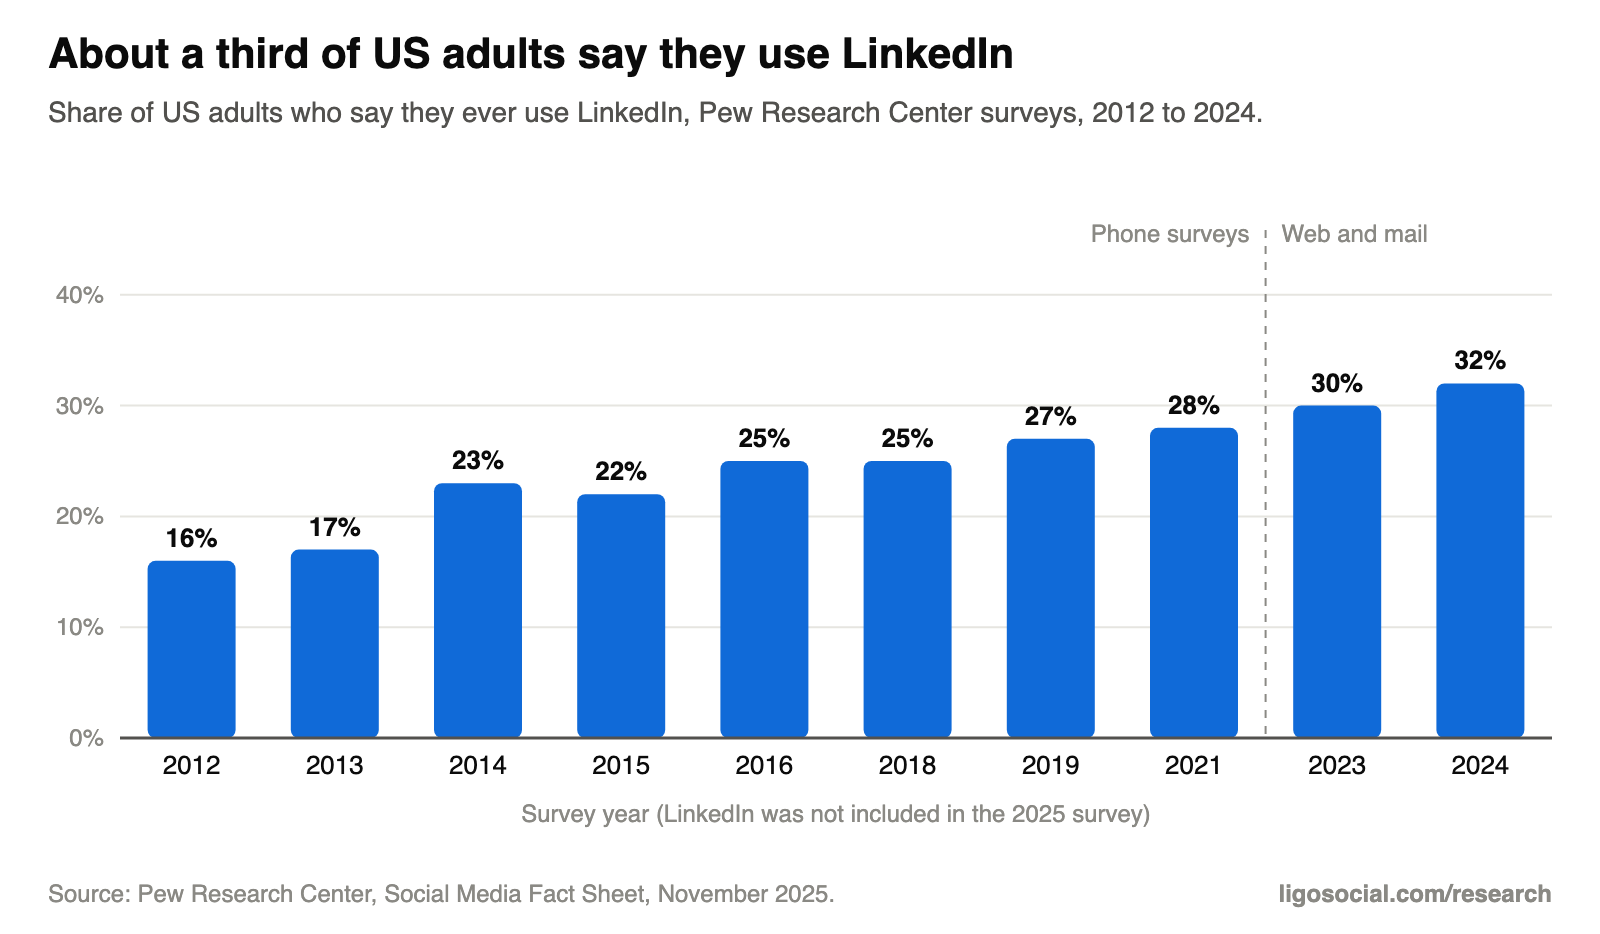
- 32% of US adults say they use LinkedIn, double the 16% of 2012 (Pew Research Center).
- The typical post earns 10 engagements and 1 comment. The typical engagement rate is 0.32%, falling from 0.96% under 1,000 followers to 0.12% above 10,000.
- Against the same author's text-only posts: images +36%, documents +22%, video +17%, link previews -15%, polls -50%.
- Posts over 2,400 characters got +24% vs 600 to 900 characters. Sunday got +9%, and the hour of day barely matters.
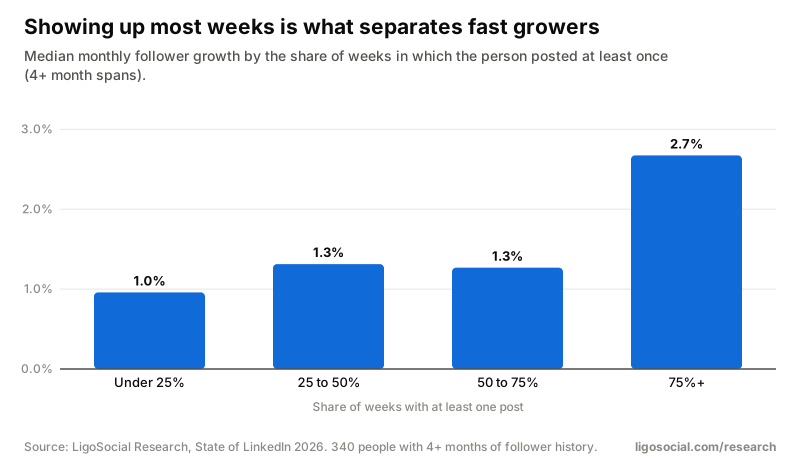
- People who posted in 75%+ of weeks grew followers 2.7% a month, vs 1.0% for people who posted in under a quarter of weeks.
- 45% of posts in the first half of 2026 read as AI (59% at the late 2024 peak), and they got 21% less engagement. On company pages the share is 67%.
Contents
- 1What are the most important LinkedIn statistics?
- 2How many people use LinkedIn?
- 3What happens on LinkedIn every minute?
- 4How much revenue does LinkedIn make?
- 5What is a good engagement rate on LinkedIn?
- 6Why do engagement rate statistics disagree?
- 7Which LinkedIn post format gets the most engagement?
- 8How long should a LinkedIn post be?
- 9When is the best time to post on LinkedIn?
- 10How often should you post on LinkedIn?
- 11How much of LinkedIn is written by AI?
- 12What kind of posts get the most engagement?
- 13Do hashtags still work on LinkedIn?
- 14Is LinkedIn engagement going down?
- 15How do LinkedIn company pages perform?
- 16Which popular LinkedIn statistics do not hold up?
- 17Where do these numbers come from?
What are the most important LinkedIn statistics?
The key LinkedIn statistics in one line: 1.3 billion+ members, 32% of US adults use it, the typical post earns 10 engagements (0.32% of followers), image posts beat text by 36%, and posts that read as AI get 21% less engagement. Platform figures below come from LinkedIn, Microsoft and Pew Research Center; post figures come from our own analysis of real posts.
| Statistic | Number | Source |
|---|---|---|
| Members worldwide | 1.3 billion+ | |
| Annual revenue | $19.8 billion | |
| Revenue growth, quarter to June 2026 | +12% | Microsoft |
| US adults who use LinkedIn | 32% | Pew Research Center |
| Job applications every minute | about 8,200 | |
| Engagements on the typical post | 10 | LigoSocial Research |
| Typical engagement rate | 0.32% | LigoSocial Research |
| Image posts vs text-only | +36% | LigoSocial Research |
| Posts over 2,400 characters | +24% | LigoSocial Research |
| Posts that read as AI, 2026 | 45% | LigoSocial Research |
| Engagement on AI-sounding posts | -21% | LigoSocial Research |
| Company posts that read as AI | 67% | LigoSocial Research |
Post figures compare each author with themselves, for example their image posts against their own text-only posts. 2026 covers January to September.
How many people use LinkedIn?
LinkedIn reports more than 1.3 billion members. Its statistics page splits them into four regions: 430 million+ in Europe, the Middle East and Africa, 410 million+ in Asia Pacific, 290 million+ in North America and 226 million+ in South and Central America. The site runs in 36 languages.
Members are not the same as active users. LinkedIn's statistics page lists members, not monthly active users, so check the source of any monthly active user figure before you quote it.
In the US, 32% of adults told Pew Research Center in 2024 that they use LinkedIn, up from 16% in 2012. That puts it behind YouTube (85%), Facebook (70%) and Instagram (50%), just behind TikTok (33%) and ahead of X (21%).
What happens on LinkedIn every minute?
Every minute, LinkedIn members view more than 1.8 million feed updates, make 18,000+ connections and submit about 8,200 job applications, according to LinkedIn's own figures. Reading the feed dwarfs everything else:
1.8M+
feed updates viewed every minute
Source: LinkedIn
18,000+
connections made every minute
Source: LinkedIn
~8,200
job applications submitted every minute
Source: LinkedIn
~123
hours of learning content consumed every minute
Source: LinkedIn
93
people add a new role to their profile every minute
Source: LinkedIn
How much revenue does LinkedIn make?
LinkedIn lists $19.8 billion in annual revenue. In Microsoft's results for the quarter to June 30, 2026, LinkedIn revenue grew 12% year on year (10% in constant currency). LinkedIn also reports 26% year-on-year growth in paid video ads and five straight years of double-digit member growth.
$19.8B
annual revenue
Source: LinkedIn
+12%
revenue growth, quarter to June 2026
Source: Microsoft
+26%
growth in paid video ads, year on year
Source: LinkedIn
5 years
of double-digit member growth
Source: LinkedIn
For B2B marketers, LinkedIn's B2B Institute adds the 95-5 rule. In its words, “95% of your potential buyers aren't ready to buy today.” It is the case for posting steadily, not only when you have something to sell.
What is a good engagement rate on LinkedIn?
For everyday professionals the typical engagement rate is 0.32%: the median post's reactions, comments and reposts divided by followers. The top quarter of authors reach 0.83% or more. Rates fall as audiences grow, so compare yourself with people your size.
| Followers | Engagement per post | Engagement rate | Top 25% rate |
|---|---|---|---|
| Under 1,000 | 4 | 0.96% | 2.17% |
| 1,000 to 3,000 | 7.5 | 0.43% | 0.98% |
| 3,000 to 6,000 | 13 | 0.31% | 0.64% |
| 6,000 to 10,000 | 15 | 0.18% | 0.42% |
| 10,000+ | 20 | 0.12% | 0.28% |
Typical author in each band, September 2025 to September 2026. Engagement = reactions + comments + reposts. Rate = engagement / followers.
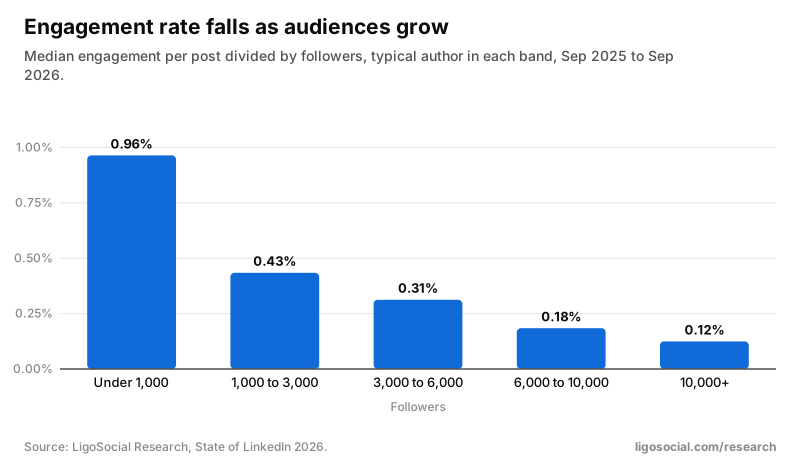
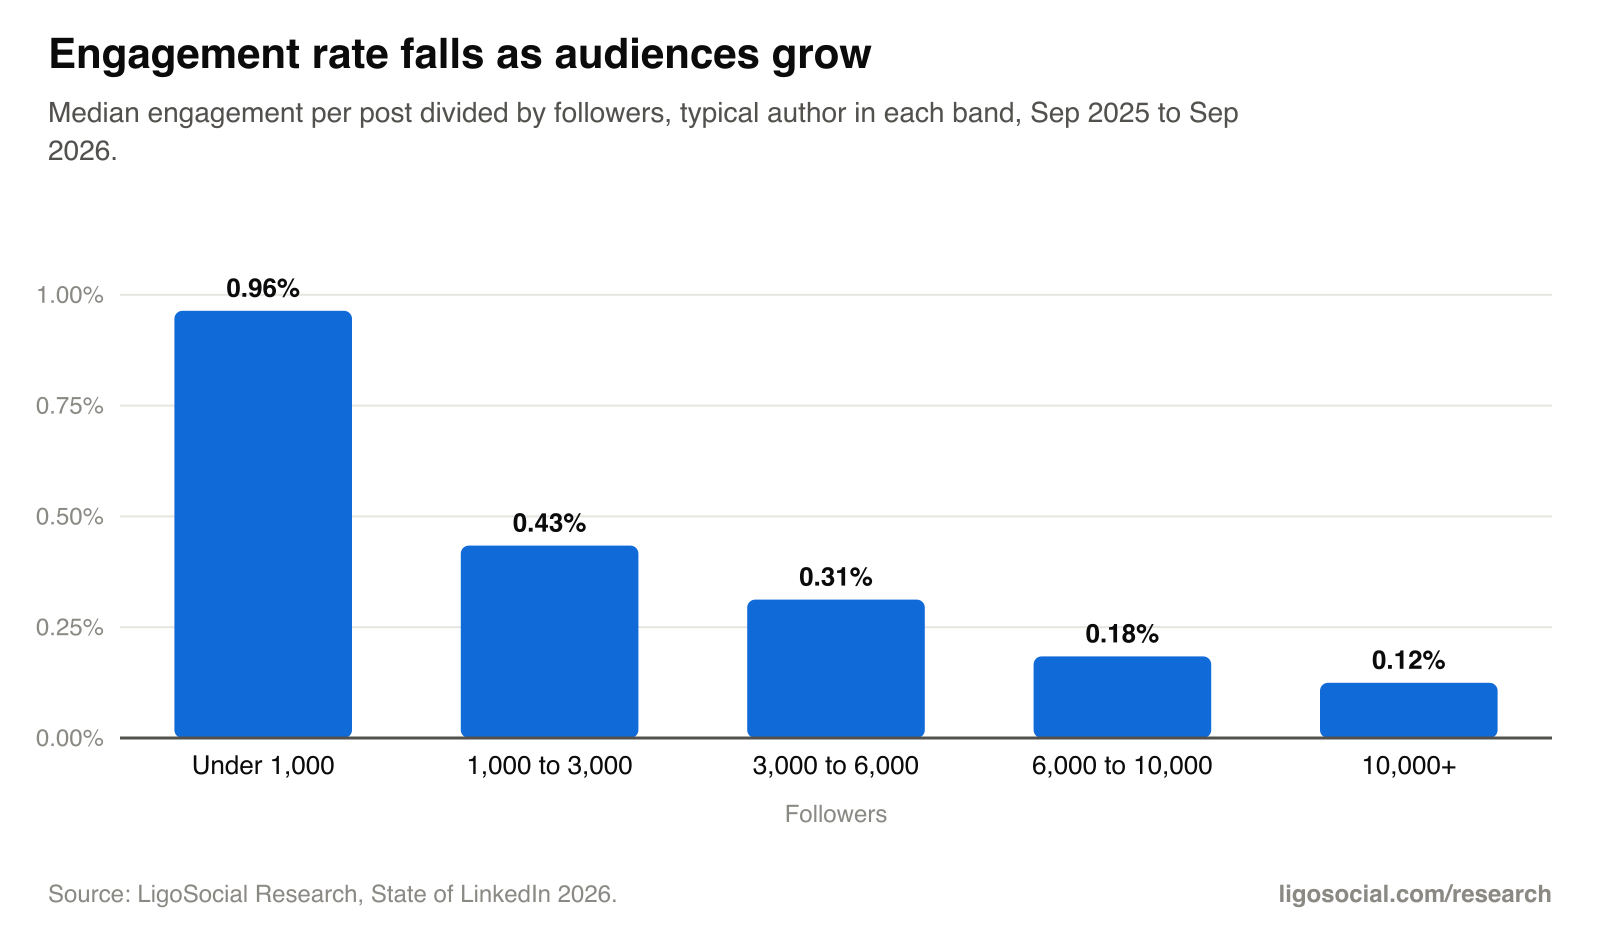
Company pages run lower per follower: 0.37% under 2,500 followers, 0.25% at 2,500 to 15,000, 0.06% at 15,000 to 100,000 and under 0.01% past a million. Benchmarks by size: personal profiles and company pages.
Why do engagement rate statistics disagree?
Because they divide by different things. Rates based on followers, like ours, look small: 0.32% for the typical professional. Rates based on impressions look much bigger: Socialinsider puts the average for business pages at 5.20% of impressions in its 2026 benchmarks, based on 1.3 million posts from 16,645 pages. Its rate divides engagement by impressions, which, in Socialinsider's words, “is the same formula LinkedIn uses.”
Both can be right. Impressions count only the people who saw a post; followers count everyone who could have. Before you compare your number with a benchmark, check what was divided by what, whose accounts were measured (people or company pages) and whether it is an average or a median. A few viral posts pull an average up; the median is what a normal post gets.
Which LinkedIn post format gets the most engagement?
Images. Against the same author's text-only posts, image posts got +36%, documents (carousels) +22% and video +17%. Link previews lost 15% and polls lost 50%, partly because poll votes are not counted as reactions.
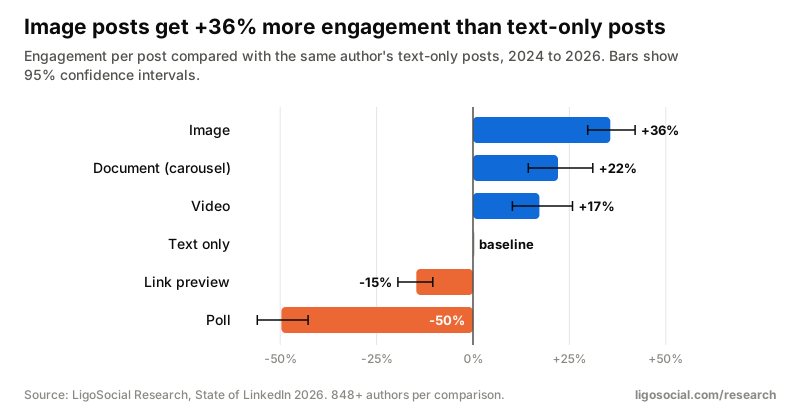
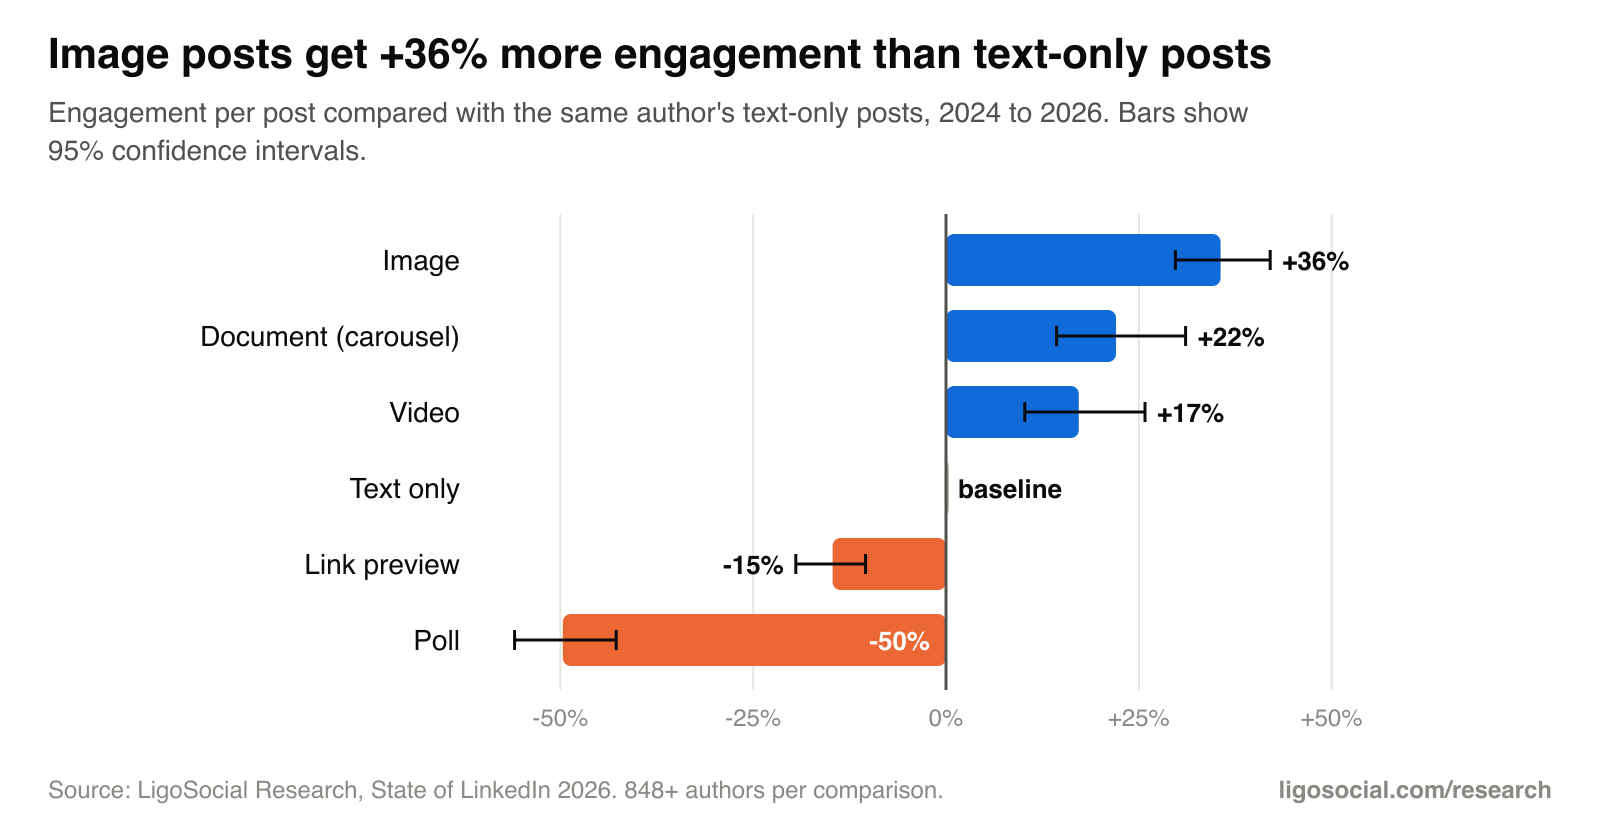
- Documents pay only past 10 pages: 16+ pages got +26% vs the author's average post, while 1 to 10 pages sat at about -4%. Documents are also the most reposted format.
- Long video beats short clips: videos over 5 minutes got +27%, clips under 30 seconds -7%.
- The link penalty is the preview card: a URL typed into the body of a post cost only 4%.
- On company pages link previews did worst of all, at -40% vs the same page's image posts.
Full breakdown: LinkedIn post formats compared.
How long should a LinkedIn post be?
Longer than most advice suggests. Posts over 2,400 characters got +24% engagement vs the same author's 600 to 900 character posts, and 1,300 to 1,800 characters got +8%. Posts under 150 characters got -31%. LinkedIn allows up to 3,000 characters in a post.
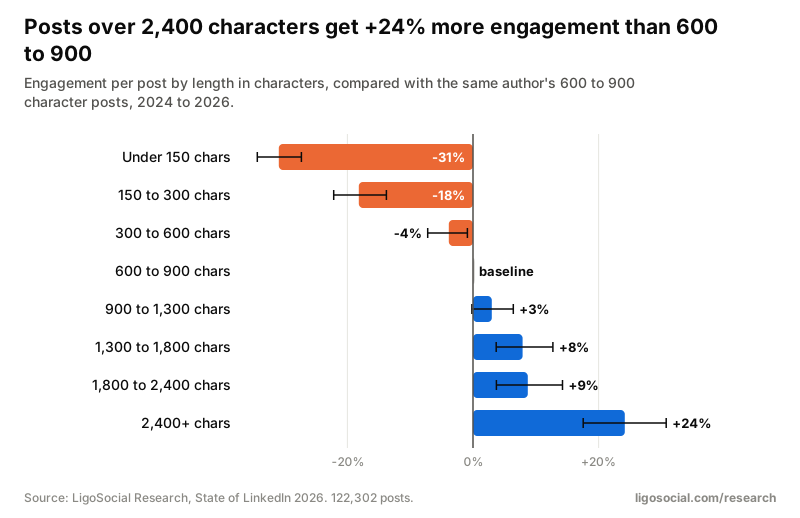
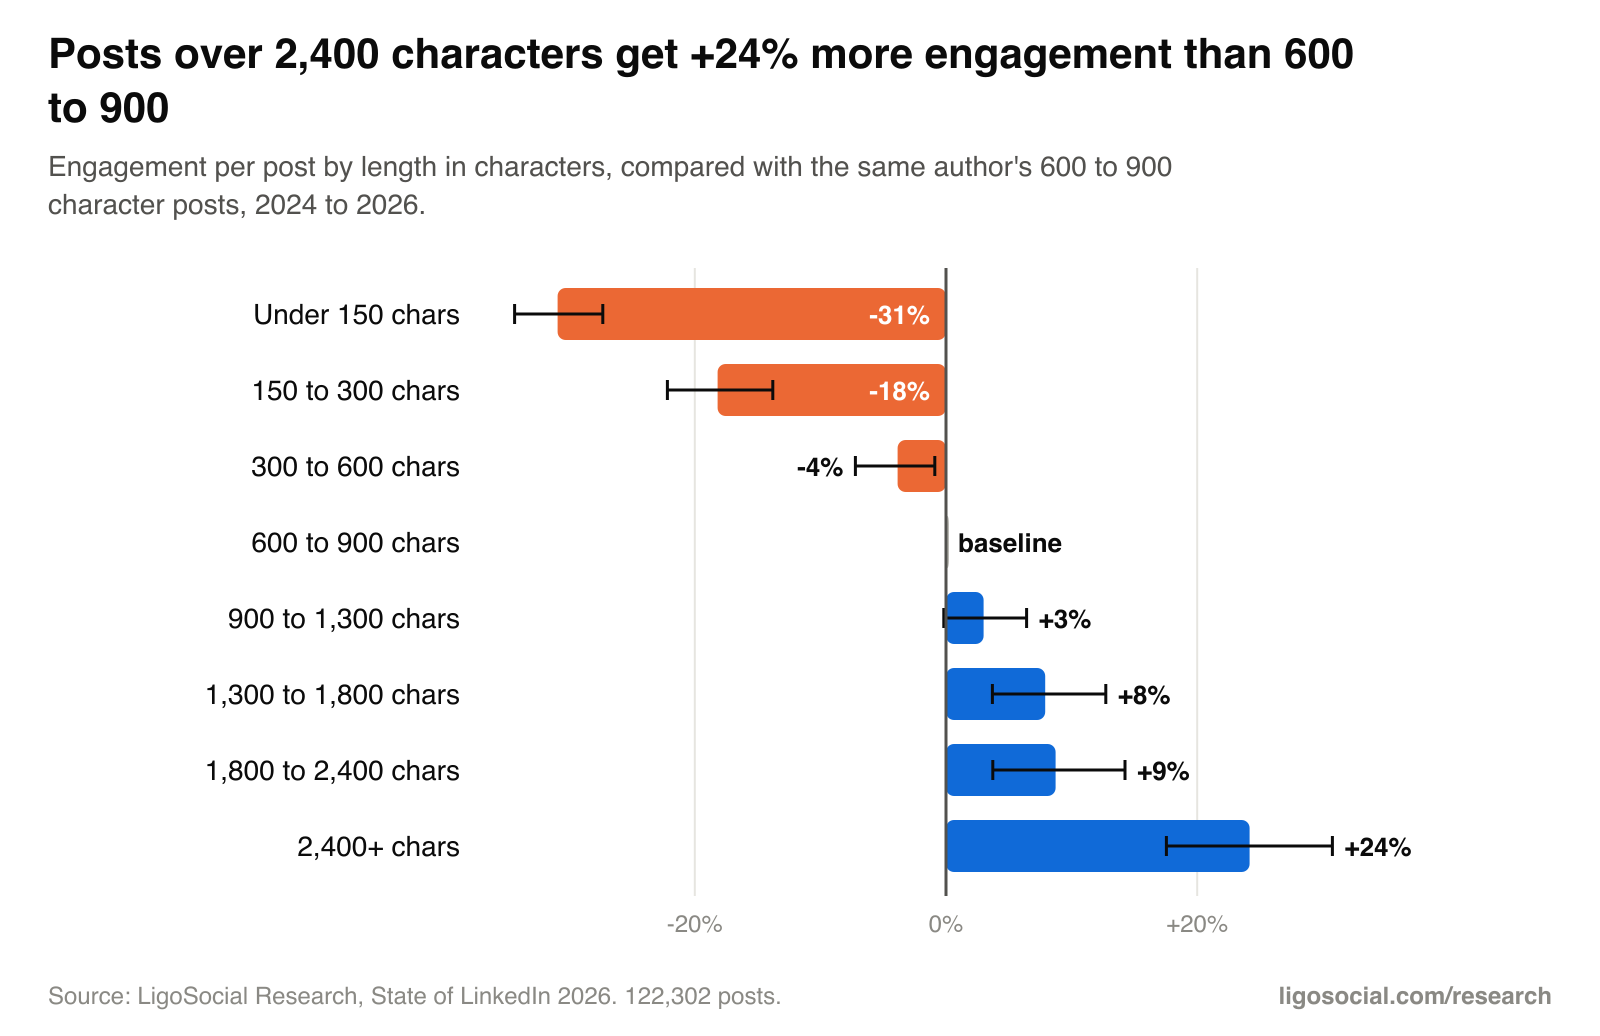
The premium holds in every follower band and for comments too. More on how long a LinkedIn post should be.
When is the best time to post on LinkedIn?
For personal profiles the hour matters far less than the advice suggests. Comparing each author's posts in their own local time, every slot from 6am to 10pm sat between -2% and +4% of their average. Sunday was the one day that stood out, at +9%, yet only 7% of posts go out on a Sunday.
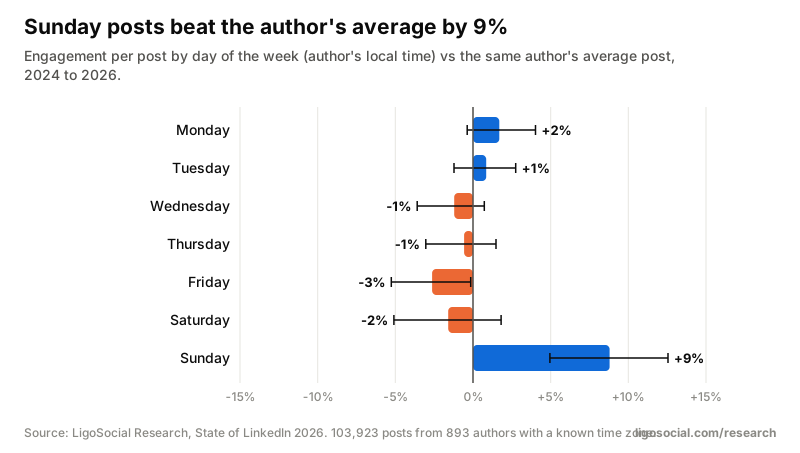
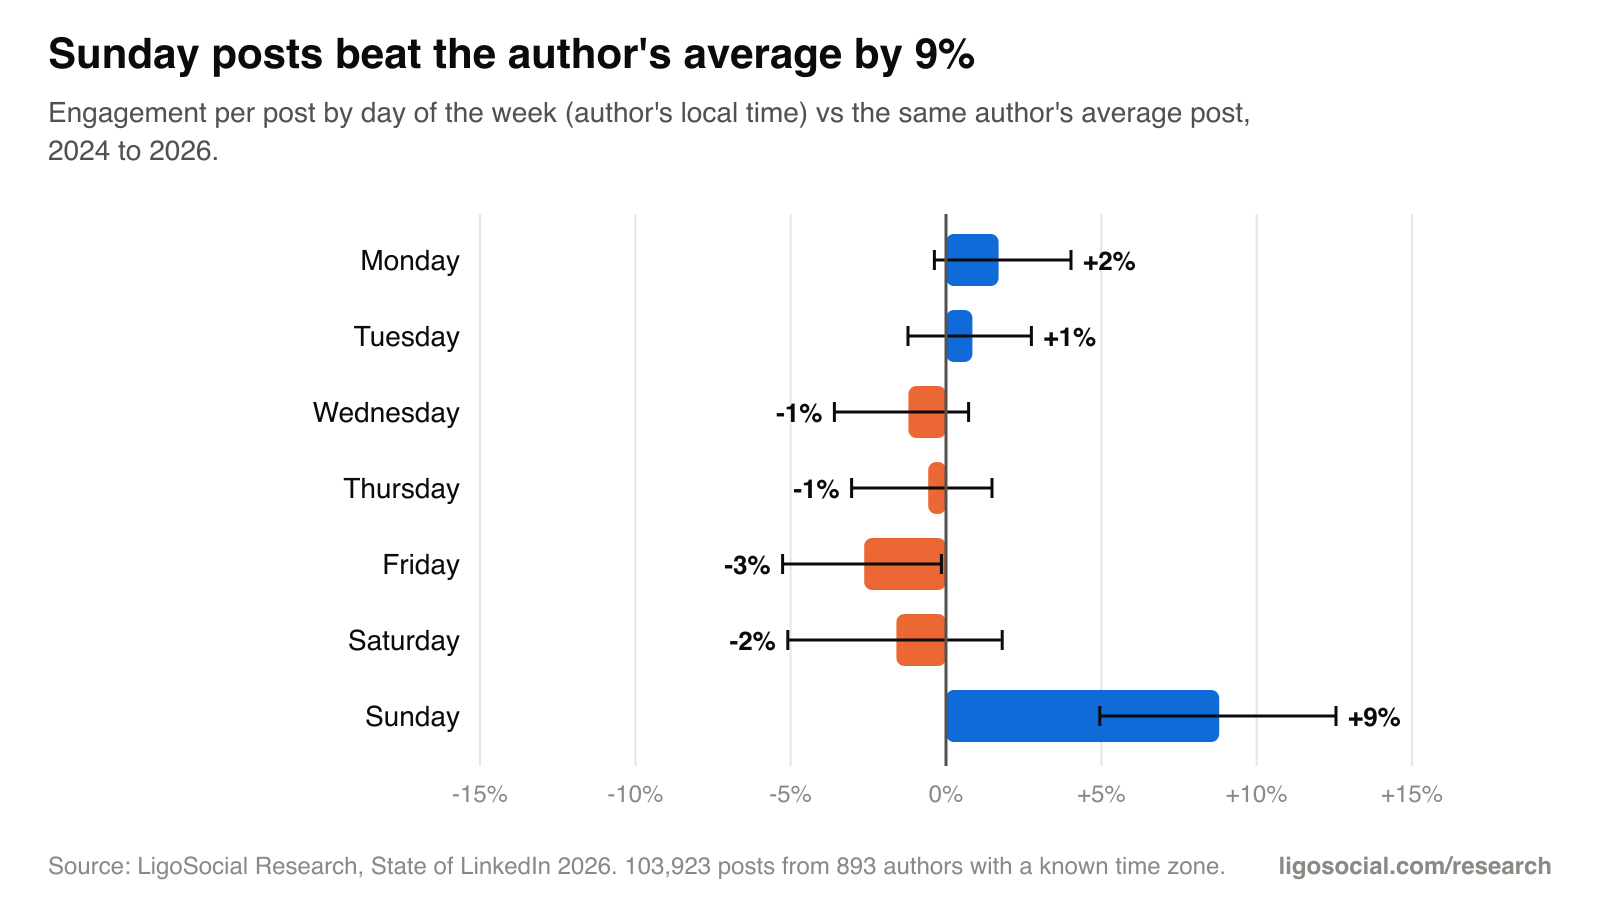
Other studies measure it differently. Buffer's analysis of 4.8 million posts sent through its tool names Wednesday at 4pm as the strongest slot. Our comparison is within each author, in their local time, which removes the effect of who tends to post when. For company pages, 4 to 6pm local time was the one window that stood out (+17%).
Details: best day and time for personal profiles and for company pages.
How often should you post on LinkedIn?
Often enough to be consistent, without stacking posts. People who posted in at least 75% of weeks grew their followers 2.7% a month, against 1.0% for those who posted in fewer than a quarter of weeks. The fastest growers posted 7.6 times a month vs 3.2 for the slowest, with a longest weekly streak of 13 weeks vs 6.
- A second post within 24 hours got -10% vs posts made 2 to 4 days apart.
- Each extra post in a week earns less per post (-9% at 2 posts, -23% at 5 to 7) but more in total.
- The first post after a break of 30+ days got +26%.
More on how often to post on LinkedIn.
How much of LinkedIn is written by AI?
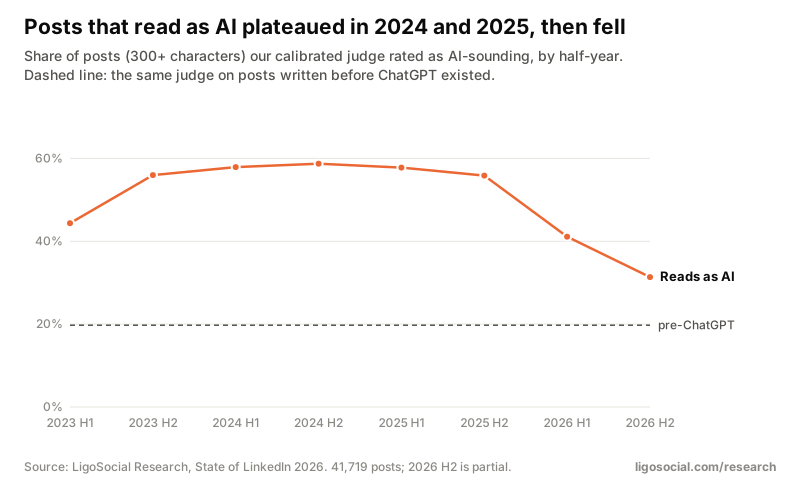
About half of it, depending on the year. The share of posts that read as AI rose from 44% in early 2023 to 59% in late 2024, stayed near that level through 2025 and fell to 45% in the first half of 2026. The same check flags 20% of posts written before ChatGPT existed, so read that as the floor.
-21%
engagement on posts that read as AI, vs the same author's other posts
Source: LigoSocial Research
+33%
engagement on posts that read as clearly human
Source: LigoSocial Research
26%
of posts used an em dash in 2025, up from 3.5% in 2023
Source: LigoSocial Research
67%
of company page posts read as AI, vs 45% of personal posts (2026)
Source: LigoSocial Research
Readers react to the voice, not the punctuation. Posts with an em dash were not penalised (+7%), and the AI gap holds within the same topic, post type and length. The full study: do AI-written LinkedIn posts get less engagement?
Does your next post read as AI?
Paste it into the free LinkedIn AI Detector. It scores the post and points at the phrases and patterns that give it away. Nothing you paste is stored.
What kind of posts get the most engagement?
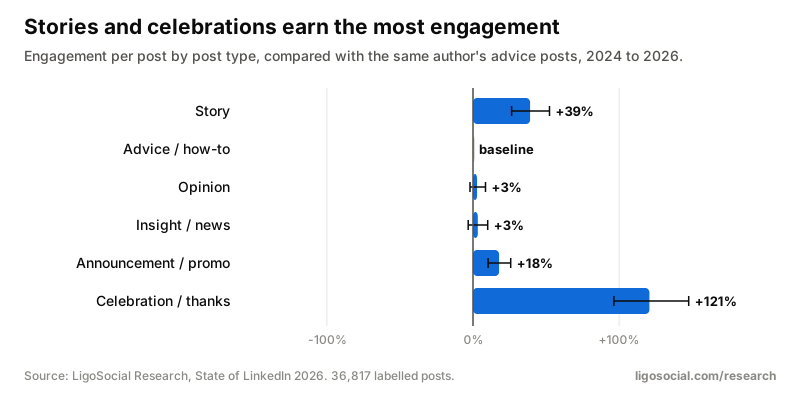
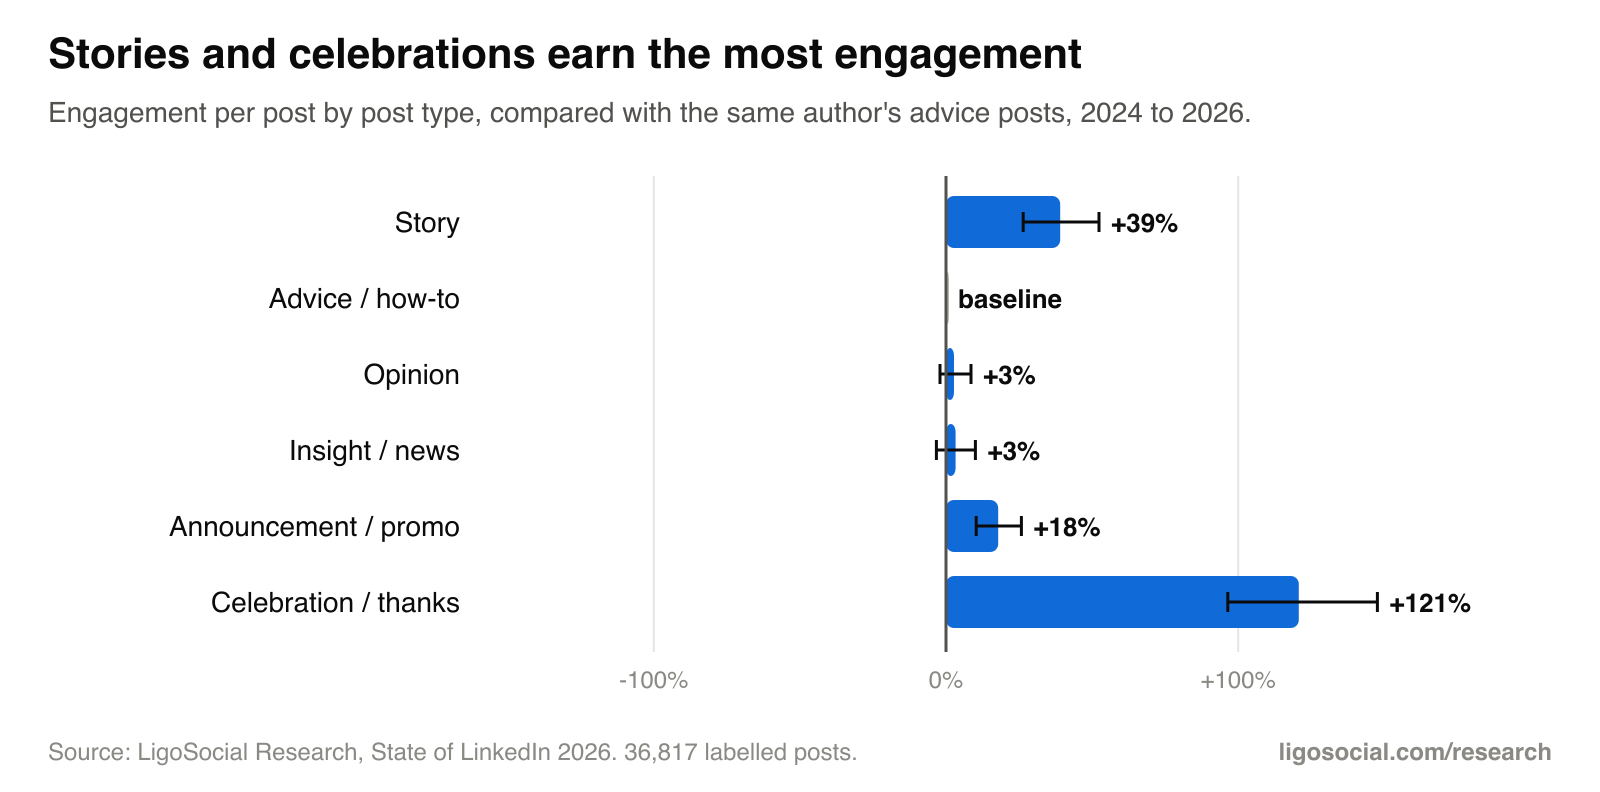
Posts about real moments. Against the same author's advice posts, stories got +38% and celebration or thank-you posts +90%. Posts that draw on first-hand experience got +41%, and posts with concrete specifics (numbers, names, places) +19%.
- Opening with a story beat opening with a bold claim by 31%; question openers did 6% worse.
- Ending with “What do you think?” added 5% more comments but cost 7% of total engagement.
- Tagging the people involved: +35% for one person, +126% for four or more.
- Careers posts got +35% and AI or tech posts -13%, yet sales, specialist expertise and AI make up 55% of what people write.
- Promotional posts were not penalised (0%).
On company pages, team and culture posts got +82% and company news +80% vs the same page's product posts, while thought leadership, the most common company post, got -22% vs the page average. See what to post on a LinkedIn company page.
Do hashtags still work on LinkedIn?
They neither help much nor hurt. Against the same author's posts with none, 1 to 2 hashtags got +3%, 3 to 5 got +6% and 6 or more +13%. Use is falling anyway: 68% of posts carried a hashtag in 2023, 41% in 2026. Details: do hashtags work on LinkedIn?
Is LinkedIn engagement going down?
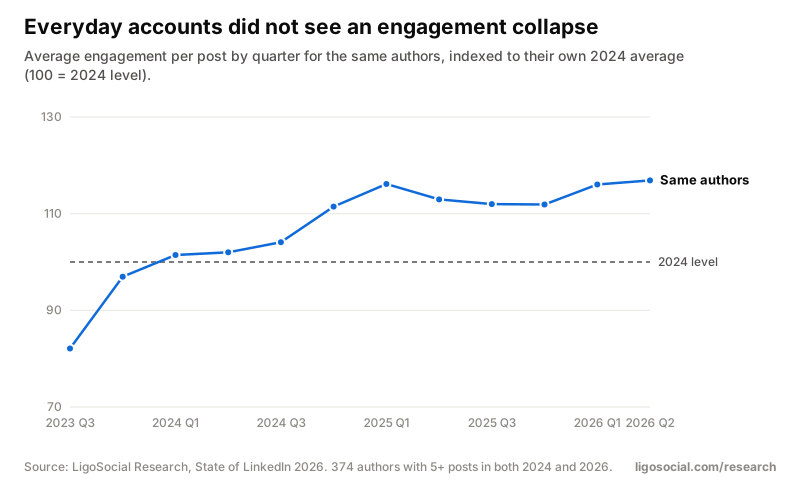
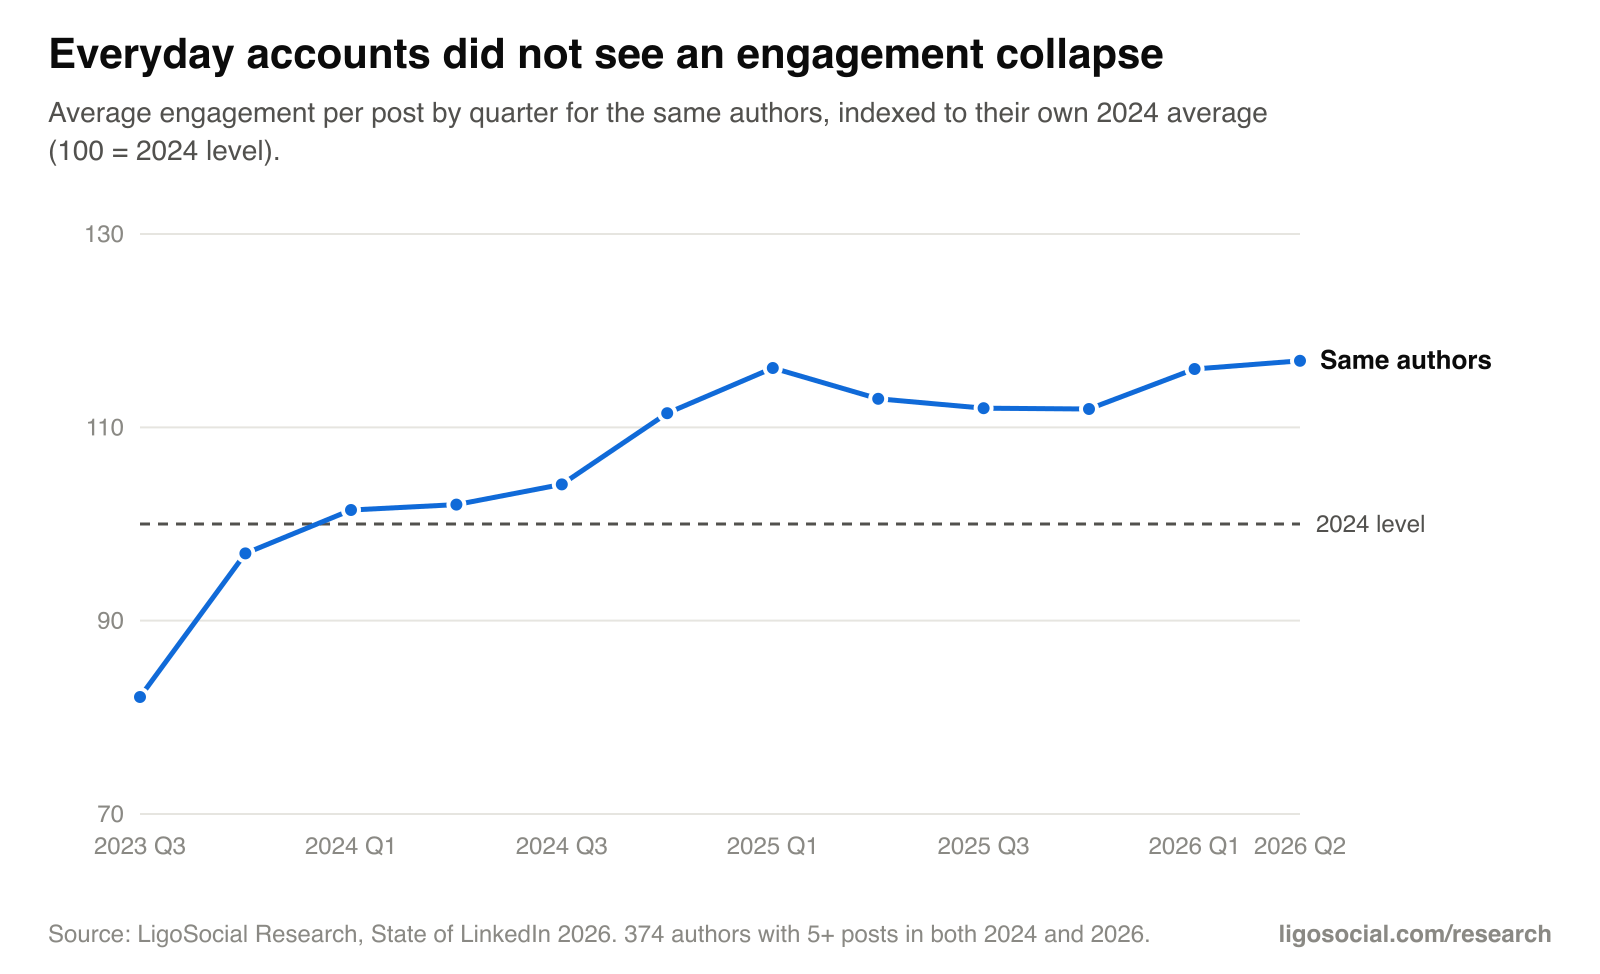
Not for everyday professionals. The same people got +6% engagement per post in 2025 vs 2024 and +7% in 2026 so far, and comments grew from 11% of all engagement in 2024 to 20% in 2026. Reports of falling reach tend to describe views and large creators; we measure reactions, comments and reposts.
Comments arrive early and reactions keep coming: at 12 to 24 hours old a post has 75% of its eventual comments but only 55% of its total engagement, so judge a post after a week, not a day.
How do LinkedIn company pages perform?
Company pages collect reactions, not conversation. Comments are 3% of their engagement, against 20% on personal profiles. Two in three company posts read as AI (67% in the first half of 2026), and those got 14% less engagement than the same page's other posts.
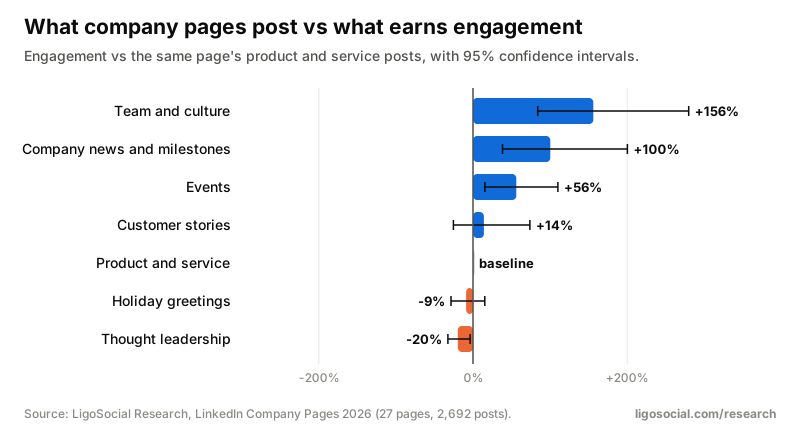
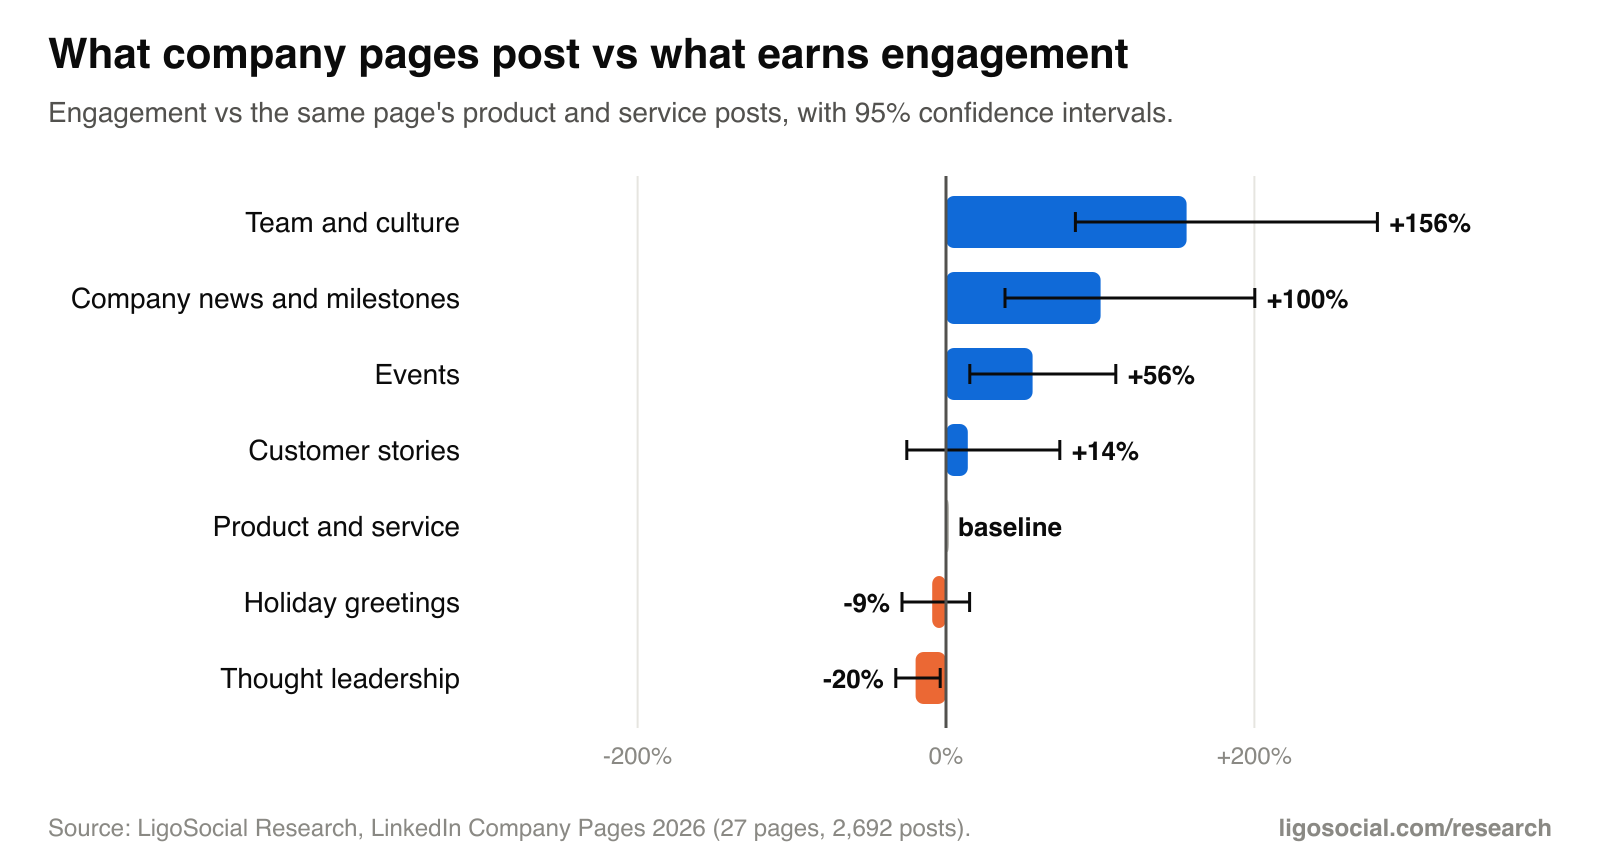
- Team and culture +82%, company news +80%, hiring +59% and events +33% vs the same page's product posts.
- Posts featuring a named person: +37%.
- Thought leadership is 25% of company posts and the weakest type, at -22% vs the page average.
- 4 to 6pm local time: +17%, though only 10% of company posts go out then.
The full study: LinkedIn company pages 2026.
Which popular LinkedIn statistics do not hold up?
Some claims get copied from one statistics page to the next. Here is how the common ones compare with what we measured.
- Partly true
“Carousels get several times the engagement of other posts.”
Documents beat the same author's text-only posts by 22%, behind images at +36%. The gain comes from long documents: 16+ pages got +26%, while 1 to 10 pages sat at -4%.
See the data - Does not hold up
“LinkedIn engagement has collapsed.”
The same everyday authors got 6% more engagement per post in 2025 and 7% more in 2026 than in 2024. Falling-reach reports usually describe views or large creators.
See the data - Does not hold up
“AI-written posts perform just as well.”
Posts that read as AI got 21% less engagement than the same author's other posts, and the gap holds within the same topic, post type and length.
See the data - Does not hold up
“Post at 8am on a weekday.”
For personal profiles every hour from 6am to 10pm sat within -2% to +4% of the author's average. Sunday (+9%) was the only day that stood out.
See the data - Partly true
“Posting every day is the fastest way to grow.”
Consistency is the strongest growth signal (2.7% a month for people posting in 75%+ of weeks vs 1.0%), but each extra post in a week earns less per post and a second post within 24 hours costs 10%.
See the data - Partly true
“Links in your post kill your reach.”
Link preview cards cost 15% of engagement. A URL typed into the body of the post cost only 4%.
See the data - Does not hold up
“Hashtags are dead.”
Posts with 6+ hashtags got 13% more engagement than the same author's posts with none. A small lift, not a penalty.
See the data - Does not hold up
“End every post with a question to get more engagement.”
“What do you think?” endings added 5% more comments but lost 7% of total engagement, and question openers did 6% worse than bold-claim openers.
See the data
Where do these numbers come from?
Platform figures come from primary sources: LinkedIn's pressroom statistics page, Microsoft's earnings release for the quarter to June 30, 2026, Pew Research Center's Social Media Fact Sheet, the LinkedIn Help Center and LinkedIn's B2B Institute. We checked each one in October 2026.
Post figures are our own: 134,522 posts from 1,499 real LinkedIn profiles (January 2023 to September 2026) and 5,530 posts from 200 company pages (January 2025 to September 2026). Most comparisons are within the same author, so +36% means a person's image posts against their own text-only posts, not big accounts against small ones. Everything is aggregated and anonymised. How the data was collected and cleaned: methodology.
Common questions
- How many people use LinkedIn?
- LinkedIn reports more than 1.3 billion members. The largest regions are Europe, the Middle East and Africa (430 million+) and Asia Pacific (410 million+). In the US, 32% of adults said they use LinkedIn in Pew Research Center's 2024 survey.
- How many monthly active users does LinkedIn have?
- LinkedIn does not list a monthly active user figure on its statistics page; it reports members (more than 1.3 billion). Monthly active user numbers quoted elsewhere are estimates, so check their source before you use them.
- Is LinkedIn still growing in 2026?
- Yes. LinkedIn revenue grew 12% year on year in the quarter to June 2026, LinkedIn reports five years of double-digit member growth, and in our data the same everyday authors got 7% more engagement per post in 2026 than in 2024.
- What is a good engagement rate on LinkedIn?
- For personal profiles the typical rate is 0.32% of followers per post, and the top quarter reach 0.83%. Small accounts run higher (0.96% under 1,000 followers) and large ones lower (0.12% above 10,000). Rates measured against impressions are far higher, around 5% for business pages, because they only count people who saw the post.
- What is the 95-5 rule on LinkedIn?
- It comes from LinkedIn's B2B Institute: at any moment about 95% of your potential buyers are not ready to buy and about 5% are. It argues for a steady presence over posting only when you have something to sell.
- How many characters can a LinkedIn post have?
- Up to 3,000 characters. In our data, posts over 2,400 characters got 24% more engagement than the same author's 600 to 900 character posts.
- Where can I see statistics for my own LinkedIn posts?
- LinkedIn shows impressions, reactions, comments and reposts for each post you publish, and page admins get analytics for their company page. Compare your median post with the benchmark for your follower band on this page, not your best post.
- Can I use these statistics in my own article?
- Yes. Our own figures are published under CC BY 4.0: quote them, embed the charts or download the CSV, with credit to LigoSocial Research and a link to this page. For LinkedIn, Microsoft and Pew figures, cite the original source linked next to each number.
Download the data
- CSV
Every statistic on this page, with sources
One row per statistic: value, what it measures, source and source URL.
91 rows, CSV
- CSV
Engagement benchmarks by follower band
Typical author in each band, September 2025 to September 2026.
5 rows, CSV
- CSV
All 40 findings with numbers and sample sizes
One row per finding from the State of LinkedIn 2026.
40 rows, CSV
Suggested citation
LigoSocial Research (2026). LinkedIn statistics: platform numbers and what 134,522 real posts show. https://ligosocial.com/research/linkedin-statistics
Free to reuse under CC BY 4.0: quote the numbers, embed the charts or rework the data, with credit to LigoSocial Research and a link to this page. Every figure is aggregated and anonymised; no individual, profile or post can be identified.
How we collect, clean and anonymise the data: methodology. Questions or a cut we have not published? Ask us.
Related research
- Annual reportThe State of LinkedIn 2026: what works for everyday professionals40 findings from 134,522 posts, plus what works at each follower count.
- ReportWhat is a good LinkedIn engagement rate? Benchmarks by follower countTypical engagement rate 0.32%; 0.96% under 1,000 followers, 0.12% at 10,000+.
- ReportLinkedIn post formats compared: images, carousels, video, text, links and pollsImages +36%, link previews -15%, polls -50%. Carousels only pay past 10 pages.
- ReportDo AI-written LinkedIn posts get less engagement?AI-sounding posts get 21% less engagement, and the share of them peaked in 2024 to 2025.
- ReportLinkedIn Company Pages 2026: what earns engagement, from small brands to global ones200 selected company pages of every size, 5,530 posts: benchmarks by follower band and industry, what to post, formats, timing, AI, and how pages differ from people.
- ReportHow often should you post on LinkedIn? Frequency, consistency and follower growthPost most weeks: 2.7% monthly growth vs 1.0%. Never twice in 24 hours.