
Key findings
- Outlier hits are rare and mostly unrepeatable. Only 3.6% of tweets reached 10x the creator's own median likes, and the single biggest hits were personal, off-topic stories, not product posts.
- An image is not a default booster on X, unlike LinkedIn. Text-only tweets edged out image tweets on engagement rate; video won the most bookmarks.
- 140 to 280 characters is the reliable sweet spot, but the rare long-form post (280+ characters) was the highest-variance move: lower average engagement rate, highest median multiple when it landed.
- Posting time barely predicted the biggest hits. Outliers landed roughly in proportion to ordinary posting volume across every weekday, with a modest Thursday lean.
- Save-lists were the best repeatable format: 74 tweets from 11 of 15 creators, a 1.66x median multiple and the best bookmark rate of any common pattern. See the same behavior on LinkedIn.
Contents
About this report
"Build in public" is one of the most repeated pieces of advice for indie hackers and SaaS founders on X: share what you're building, share the numbers, share the failures, and an audience follows. We wanted to know what the posts that actually spread widely had in common, and how often that even happens.
This report analyses 1,209 public posts from 15 build-in-public creators selected for this study: indie hackers, SaaS founders and developers who post openly about what they build and how it grows, posted between 2024 and September 2026. Every number is measured against each creator's own median, so one very active or very followed account cannot drive the result on its own.
How rare is a real outlier
3.6%
Finding 1
A 10x hit is rare, even in a set already skewed toward good posts
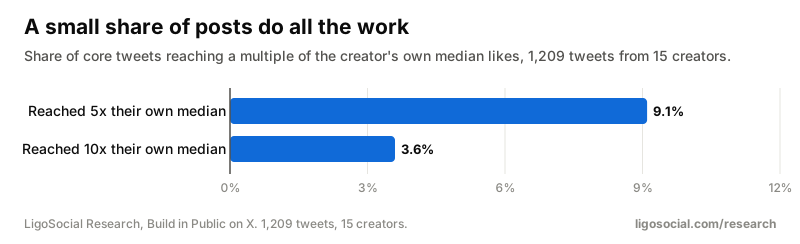
Of the 1,209 core tweets, 110 (9.1%) reached 5x or more the creator's own median likes, and only 43 (3.6%) reached 10x or more. Remember this sample was gathered by searching each creator's own top posts, so the true rate across everything they post is lower still.
842x
Finding 2
The single biggest hits were personal stories, not product posts
The top tweet by multiple of its creator's own median was @AleksDoesCode at 842x (3,370 likes), opening with a story about the German tax office seizing his business bank account, not a product update. Second was @hridoyreh at 799x (107,856 likes), opening "I accidentally deleted a browser. I bought a new PC today," a relatable mishap story. Third was @arvidkahl at 266x (155,964 likes), a one-line reaction to someone else's post. Further down the list, product-relevant formats still did well without going viral: @AleksDoesCode's "Claude is submitting my SaaS to 350+ free directories while I browse X" reached 138x, and @hridoyreh's folder-tree "system map" post reached 124x.
The takeaway is not "post about your tax problems." It is that the single biggest hits for build-in-public accounts were unpredictable, off-topic, personal moments, the kind you cannot schedule. The product-relevant formats further down the list (an AI-does-my-job post, a system map, a save-list) reached lower multiples individually, but they are formats a creator can choose to write on purpose, which makes them more useful for a content calendar than hoping for a viral rant.
Format
1.60% vs 1.39%
Finding 3
An image is not a default booster on X
Across 1,188 tweets with 1,000 or more views, text-only tweets got a median engagement rate of 1.60% (likes plus bookmarks, divided by views), against 1.39% for image tweets, 1.28% for video and 1.01% for quote tweets. Video won the most bookmarks per view (0.39%), useful for demos even where the overall engagement rate is lower. Among the 10x+ outliers specifically, 60.5% carried an image, against 64.5% in the rest of the set, essentially no difference, and only 10 of the 43 outliers had video.
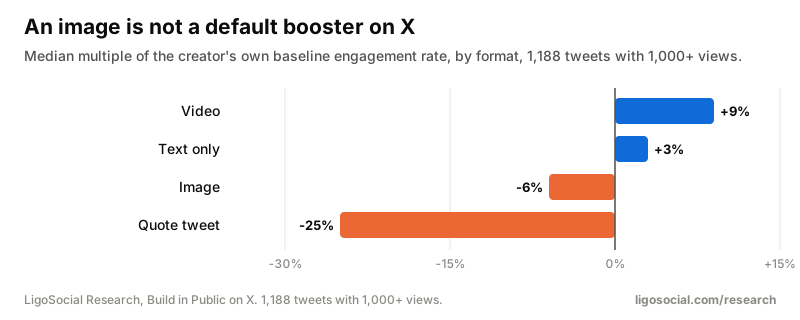
This is the opposite of what our LinkedIn research finds, where images beat text-only posts by 36%. On X, format alone does not create the outlier: what the post says appears to carry more weight than whether it has a picture.
Length
1.54% ER
Finding 4
140 to 280 characters is the reliable sweet spot, long-form is the rare swing
By engagement rate, 140 to 280 characters did best (1.54% median), ahead of 60 to 140 characters (1.38%), under 60 characters (1.24%) and over 280 characters (1.16%). But measured against each creator's own baseline instead of raw engagement rate, the pattern flips at the extreme: tweets over 280 characters had the highest median multiple of any length bucket (1.36x), while every bucket from 0 to 280 characters sat close to 1.0x (0.97x to 1.05x).
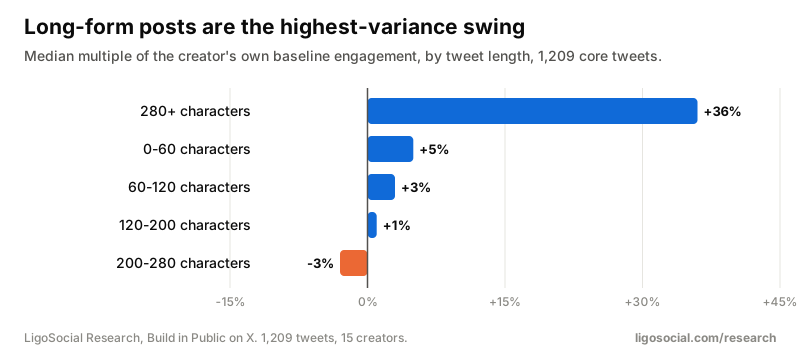
Read this as two different jobs: write short (a hook plus 2 to 4 short lines) for consistent, predictable engagement rate, and treat the occasional long-form post as your highest-variance swing, not your default. It will not always be your best-performing post by rate, but when a creator's long post connects, it tends to beat their own baseline by more than any short one does.
Posting time
n=43
Finding 5
Posting time barely predicted the biggest hits
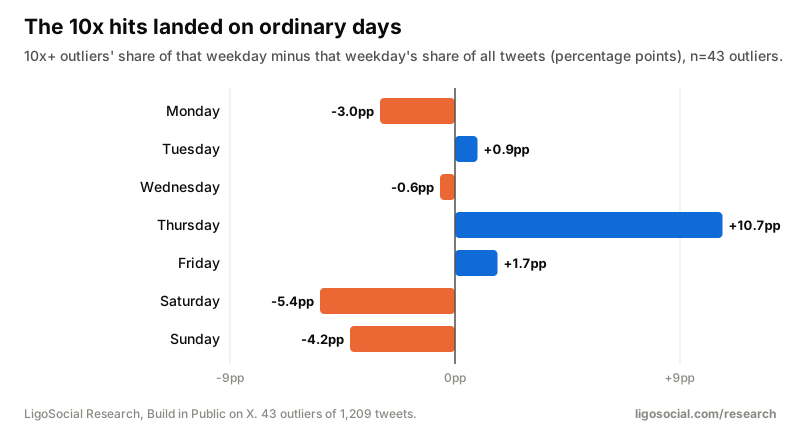
The 43 10x+ outliers landed on weekdays roughly in proportion to ordinary posting volume: Thursday was the only day where outliers ran noticeably ahead of its share of all tweets (25.6% of outliers vs 14.9% of all core tweets, a gap of about 11 percentage points), while every other weekday sat within about 5 points of its expected share. The same held for hour of day: outliers were spread across the same hours as ordinary tweets, with no concentration in any particular slot.
Hook signals
12% vs 27%
Finding 6
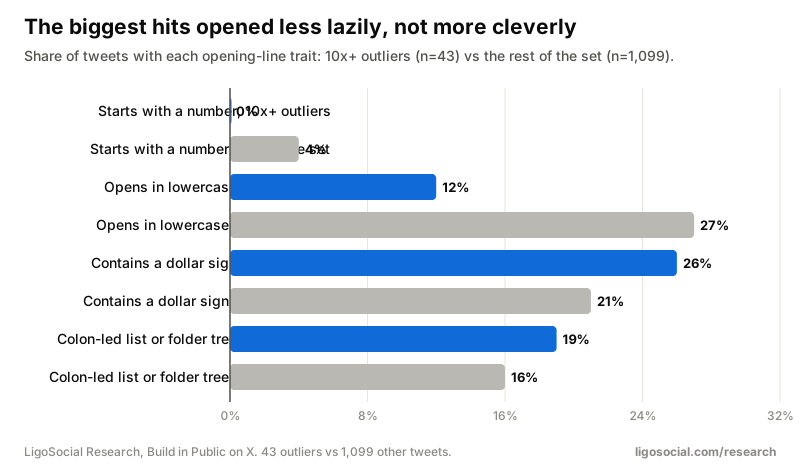
The biggest hits opened less lazily, not more cleverly
Comparing the opening line of the 43 10x+ outliers against the other 1,099 tweets: outliers opened in lowercase only 12% of the time, against 27% of the rest of the set. Outliers were somewhat more likely to mention a dollar figure (26% vs 21%) and to use a colon-led list or folder-tree structure (19% vs 16%). Starting with a bare number was, if anything, rarer among the biggest hits (0%) than the average tweet (4%), worth a myth-check against the common "lead with a number" advice.
Pattern and format templates
1.66x
Finding 7
Save-lists are frequent and reliable; system maps and launches are rarer, bigger swings
Ranking recognisable tweet patterns by median multiple of the creator's own baseline: system maps (folder-tree breakdowns of a process) led at 4.87x, but from only 7 tweets across 3 creators, thin evidence. Launch posts (2.62x, 22 tweets, 8 creators) and reply-gate posts (2.03x, 7 tweets, 4 creators) also ran high on small samples. Save-lists were the strongest combination of frequent AND high-performing: 74 tweets from 11 of the 15 creators, a 1.66x median multiple, the best bookmark rate of any pattern (1.84% of views) and a 2.69% median engagement rate. Contrarian one-liners and generic AI-tool or SEO-tactic posts, the most common patterns by volume, sat close to or below the creator's own baseline (0.99x, 1.01x and 0.81x).
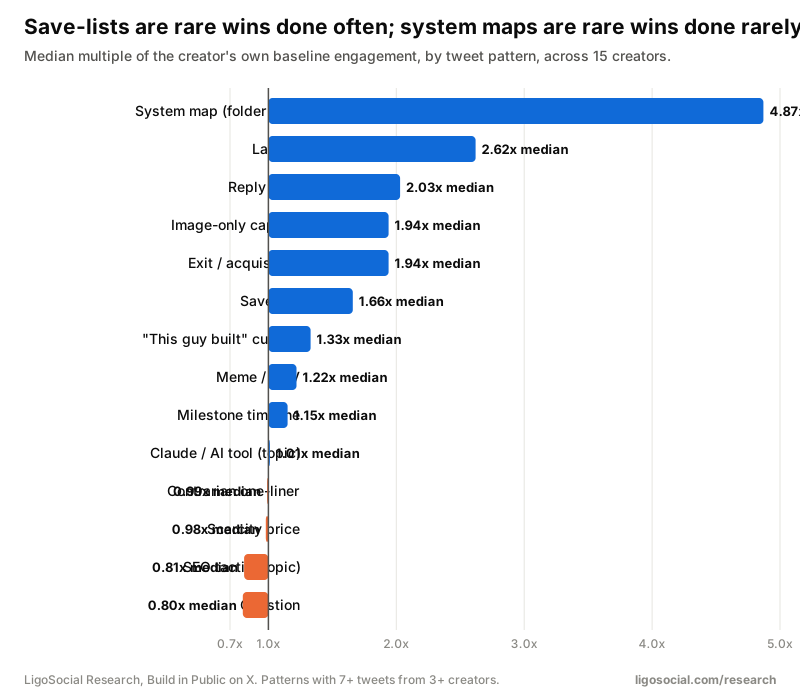
Note the n and creator count next to every bar in the chart above: the highest bars (system map, launch, reply gate) are proven on very few tweets from very few creators, so treat them as promising, not universal. If you can only build one repeatable habit from this data, a save-list is the best-evidenced choice: common enough that most of the 15 creators used it, and consistently above their own baseline when they did.
What this data cannot tell you
- This is a selected, outlier-skewed sample. We gathered each creator's own top-liked tweets, so both the outlier rate and the format and length findings describe a creator's better posts, not a random sample of everything they post.
- Causation. These are observational comparisons on a small set of accounts. A creator choosing to write a save-list after a good week is not the same as save-lists causing the good week.
- Views, saves and impressions data were incomplete for some tweets. Engagement-rate comparisons (format and length) use the 1,188 tweets with 1,000 or more recorded views; the outlier, timing, hook and pattern comparisons use likes against each creator's own median across all 1,209 core tweets.
- Small n on the sharpest findings. The posting-time and hook-signal comparisons rest on only 43 outlier tweets. Read the directional shape, not the exact percentages, as the takeaway.
- 15 creators, not a market. This describes what worked for this specific set of build-in-public accounts on X, not every niche or every account size.
For a size-for-size comparison, our State of LinkedIn 2026 study measured the same kind of within-author effects on 134,522 LinkedIn posts: there, images beat text-only posts by 36% and longer posts kept winning past 2,400 characters, the opposite of what this X data shows. The two platforms reward different things.
Post what the data says works, in your own voice
LigoSocial learns how you write from your own LinkedIn posts, then drafts posts, comments and replies in that voice right inside LinkedIn. You approve what goes out.
Add LigoSocial to ChromeOr try it at ligosocial.comCommon questions
- How often does a build-in-public post on X actually go viral?
- Rarely. Even in a sample already skewed toward each creator's best-liked tweets, only 3.6% reached 10x that creator's own median likes, and 9.1% reached 5x. Most posts, even from creators known for building in public, perform close to their own normal range.
- Does posting time matter on X for build-in-public creators?
- Not much, in this data. The biggest hits (10x+ outliers) landed across weekdays roughly in proportion to how often creators posted on each day, with only a modest Thursday lean on a small sample. What the post said predicted the outcome far more than when it went out.
- Should I add an image to every X post?
- Not automatically. Unlike LinkedIn, where images reliably beat text, this dataset found text-only tweets had a slightly higher median engagement rate (1.60%) than image tweets (1.39%). Video won the most bookmarks. Among the biggest outliers specifically, having an image made almost no difference.
- What is the ideal tweet length for engagement?
- 140 to 280 characters had the best median engagement rate in this data: a hook plus 2 to 4 short lines. Longer posts (280+ characters) had a lower average engagement rate but the highest median multiple over a creator's own baseline when they did land, making long-form more of an occasional swing than a default.
- What tweet pattern is the safest bet for a build-in-public account?
- Save-lists (a curated list of resources, tools or ideas): 74 tweets across 11 of the 15 creators studied, a 1.66x median multiple over the creator's own baseline and the best bookmark rate of any common pattern. Rarer formats like system maps and launch posts scored higher but on far fewer tweets from far fewer creators.
- Do bare numbers make a good tweet opener?
- Not in this data. None of the 43 biggest outliers opened with a bare number, against 4% of the rest of the set. Opening in lowercase was also less common among the biggest hits (12% vs 27%).
Suggested citation
LigoSocial Research (2026). What makes a build-in-public post on X get 10x engagement. https://ligosocial.com/research/x-build-in-public-outliers
Free to reuse under CC BY 4.0: quote the numbers, embed the charts or rework the data, with credit to LigoSocial Research and a link to this page. Every figure is aggregated and anonymised; no individual, profile or post can be identified.
Does your next post read as AI?
Paste it into the free LinkedIn AI Detector. It scores the post and points at the phrases and patterns that give it away. Nothing you paste is stored.
How we collect, clean and anonymise the data: methodology. Questions or a cut we have not published? Ask us.
Related research
- Annual reportThe State of LinkedIn 2026: what works for everyday professionals40 findings from 134,522 posts, plus what works at each follower count.
- ReportLinkedIn post formats compared: images, carousels, video, text, links and pollsImages +36%, link previews -15%, polls -50%. Carousels only pay past 10 pages.
- ReportHow long should a LinkedIn post be? What 134k posts showLonger posts win: 2,400+ characters +24% vs 600 to 900.