
Key findings
- Put people in the post. Posts featuring a named person got +73%; team and culture posts +156% vs product posts. Only 1 in 4 posts does it.
- Thought leadership is the most common company post (29%) and the weakest (-24% vs the page average). News, events and milestones win.
- Company pages get reactions and reposts, not conversation: comments are 4% of engagement vs 20% on personal profiles, and asking for comments cuts them by 11%.
- 73% of company posts read as AI, and those posts got 20% less engagement than the same page's other posts.
- Link previews lose 30% vs images. 4 to 6pm local time beats the morning; posts before 8am lose 29%.
- Per follower, pages keep up with people once past 1,000 followers (0.42% vs 0.43% engagement rate).
Contents
About this report
Most company-page benchmarks are built from big brands with tens of thousands of followers and a social team. Most B2B companies run something else: a page with a few hundred to a few thousand followers, posted to by a founder, a marketer or an agency between other jobs. This report is about those pages.
We selected 27 LinkedIn company pages and analysed 2,692 of their posts from January 2025 to September 2026. The median page has 1,046 followers, 9 in 10 list fewer than 50 employees, and they span software and IT, consulting, real estate, life sciences, manufacturing, education, legal services and non-profits, headquartered in the US, India, the UK, the Gulf, Europe, Africa and Singapore. We never publish page names, handles or post text.
What makes it different: every effect is measured inside the same page's own posts. We ask "does the same company do better when it posts about its team instead of its product?", not "do pages that post about their team have more followers?". A single big page cannot drive the result.
Benchmarks: what a normal company post earns
4.5
Finding 1
The typical company post earns 4.5 engagements
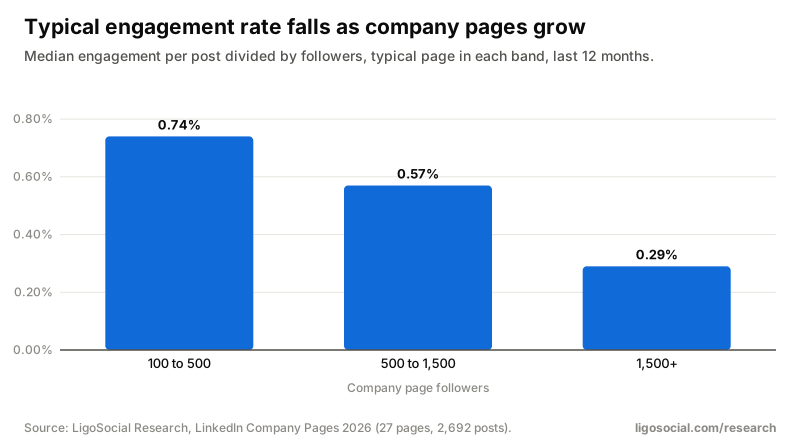
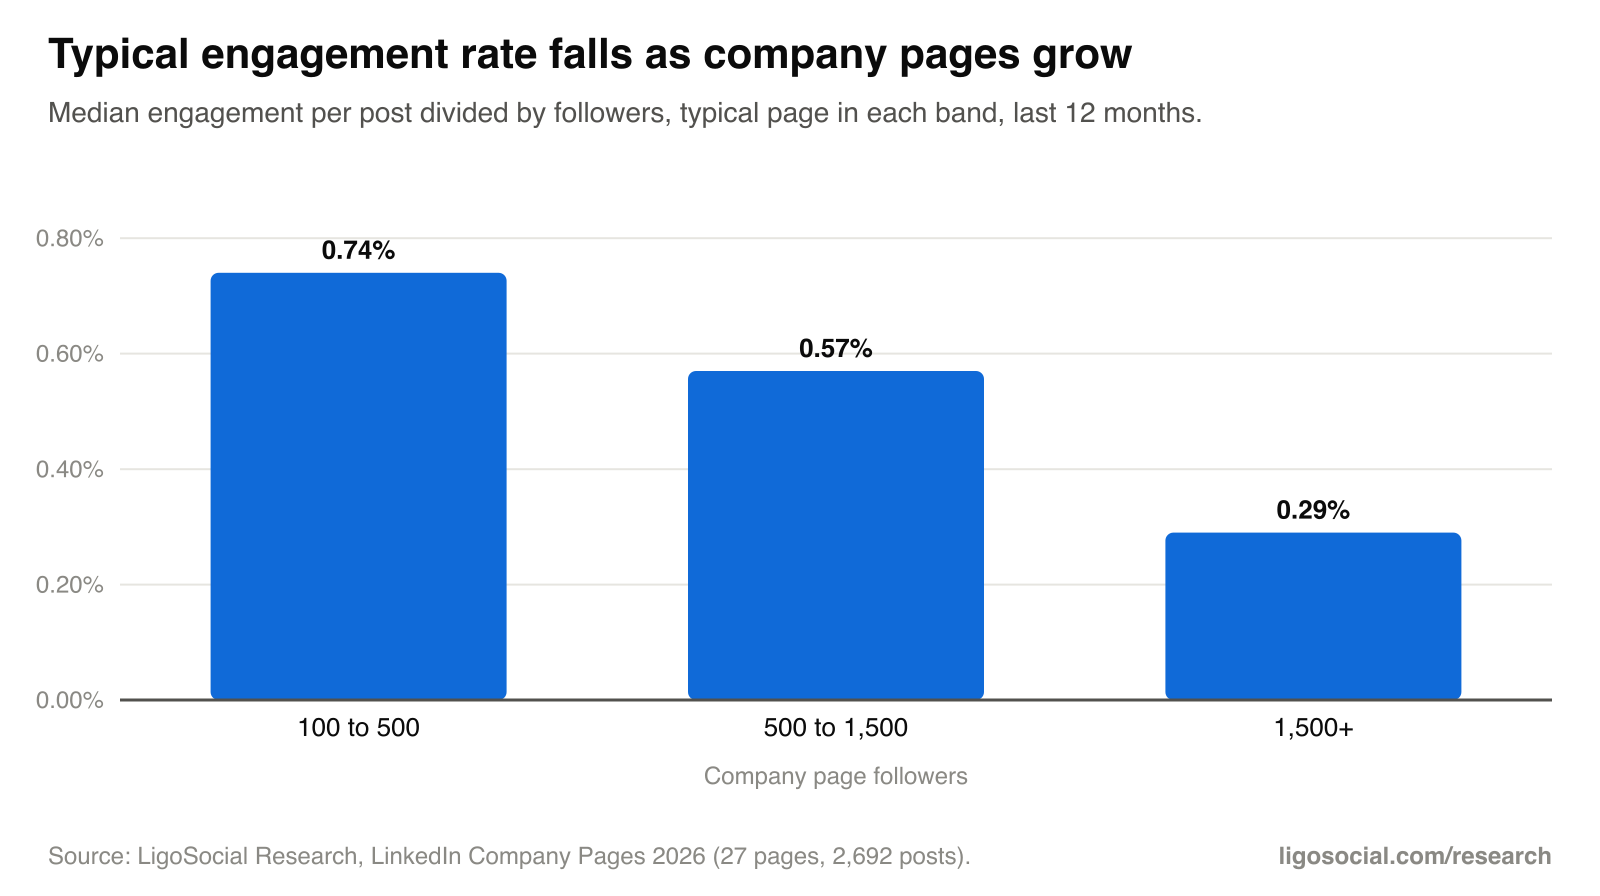
The typical page's median post got 4.5 reactions, comments and reposts combined in the last 12 months, an engagement rate of 0.48% of followers. The top quarter of pages reached 1.1%. By band: 100 to 500 followers 2 per post (0.74%), 500 to 1,500 7 (0.57%), 1,500+ 18 (0.29%).
0.42% vs 0.43%
Finding 2
Per follower, pages keep up with people past 1,000 followers
Pages with 1,000 to 3,000 followers had a typical engagement rate of 0.42%, level with personal profiles of the same size (0.43%). Below 1,000 followers pages trail people: 0.77% vs 0.96%. The "company pages are dead" line is really about small pages.
4%
Finding 3
Company pages get reactions, not conversation
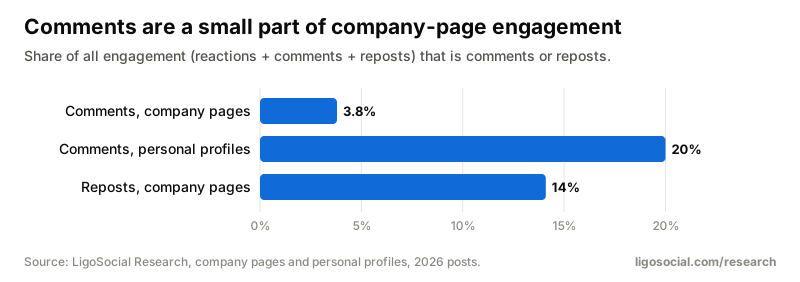
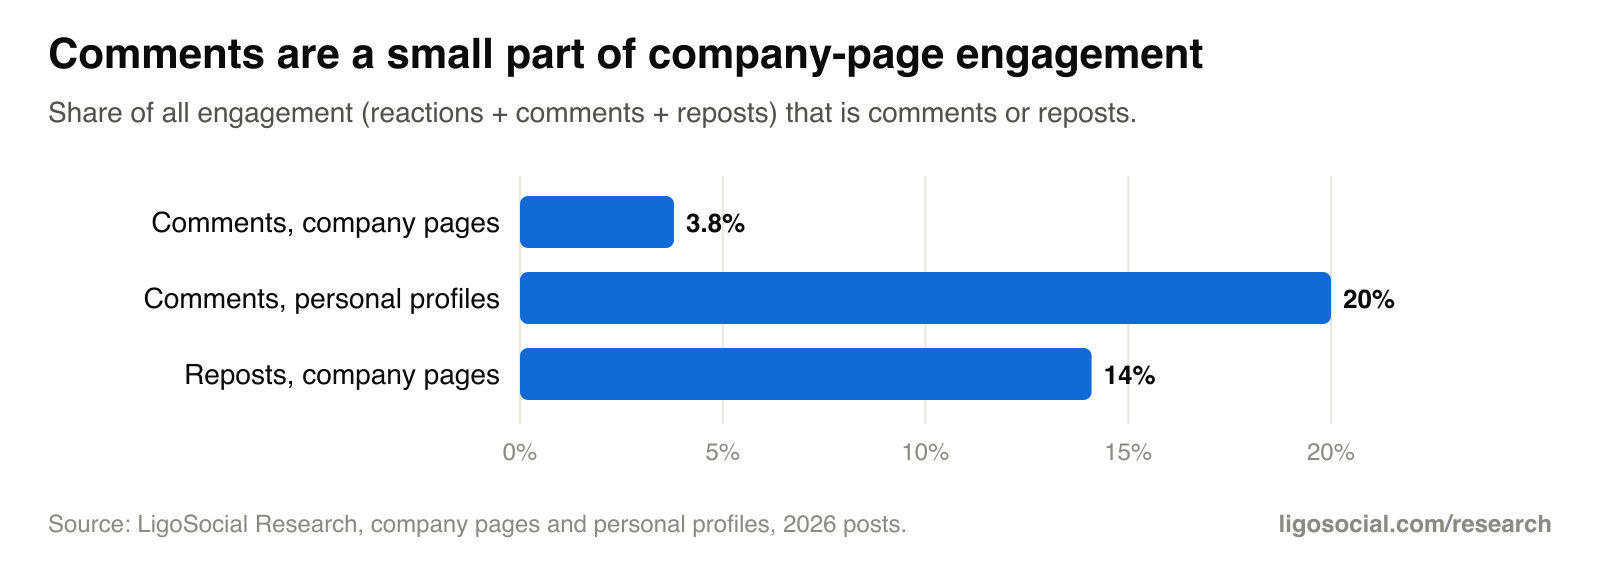
Comments were 3.8% of all engagement on company pages, against 20% on personal profiles. 72% of company posts got no comment at all. Reactions made up 82%.
17 per 100
Finding 4
Reposts do the heavy lifting
Company posts got 17 reposts per 100 reactions, far above personal profiles (1.5 to 8.4 depending on format), and 59% of posts were reshared at least once. Product posts (44 per 100 reactions) and customer stories (42) are the most reshared: this is mostly employees and partners passing posts on.
-5%
Finding 5
No collapse in 2026 either
The same 22 pages got 5% less engagement per post in 2026 than in 2025 (95% CI -19% to +13%), which is not a significant change. 55% of pages declined and 45% grew.
| Measure | Company pages | Personal profiles |
|---|---|---|
| Typical engagement per post | 4.5 | 10 |
| Typical engagement rate (per follower) | 0.48% | 0.32% |
| Engagement rate at 1,000 to 3,000 followers | 0.42% | 0.43% |
| Comments as a share of engagement | 4% | 20% |
| Posts that read as AI (2026 H1) | 73% | 41% |
| Posts with an em dash (2026) | 29% | 20% |
| Best opening line | News or announcement | A story |
| Ending with a request to comment | -11% comments | no change (+2%) |
| Tagging people | +57% to +87% | +35% to +126% |
| Link preview posts | -30% vs images | -15% vs text |
| Timing | 4 to 6pm best, before 8am worst | hour barely matters; Sunday +9% |
| Hashtags per post (median) | 6 | most posts use none |
Personal-profile figures are from our State of LinkedIn 2026 study. Company pages have a median of 1,046 followers; the personal profiles a median of about 2,000, so compare rates, not raw counts.
What to post
-24%
Finding 6
Thought leadership is the most common company post, and the weakest
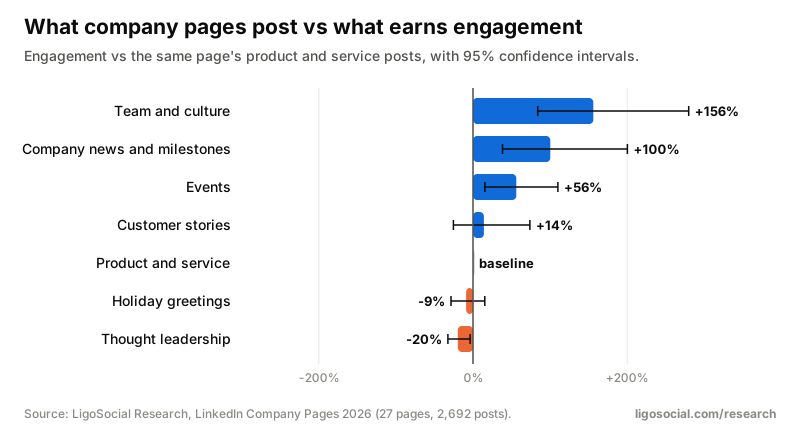
Advice, opinion and insight posts make up 29% of company posts, more than any other type, and got 24% less engagement than the same page's average post (95% CI -37% to -9%), and 20% less than its product posts. They do draw slightly more comments per reaction (7.5 per 100) than product posts (3.9).
+156%
Finding 7
Team and culture posts win by the widest margin
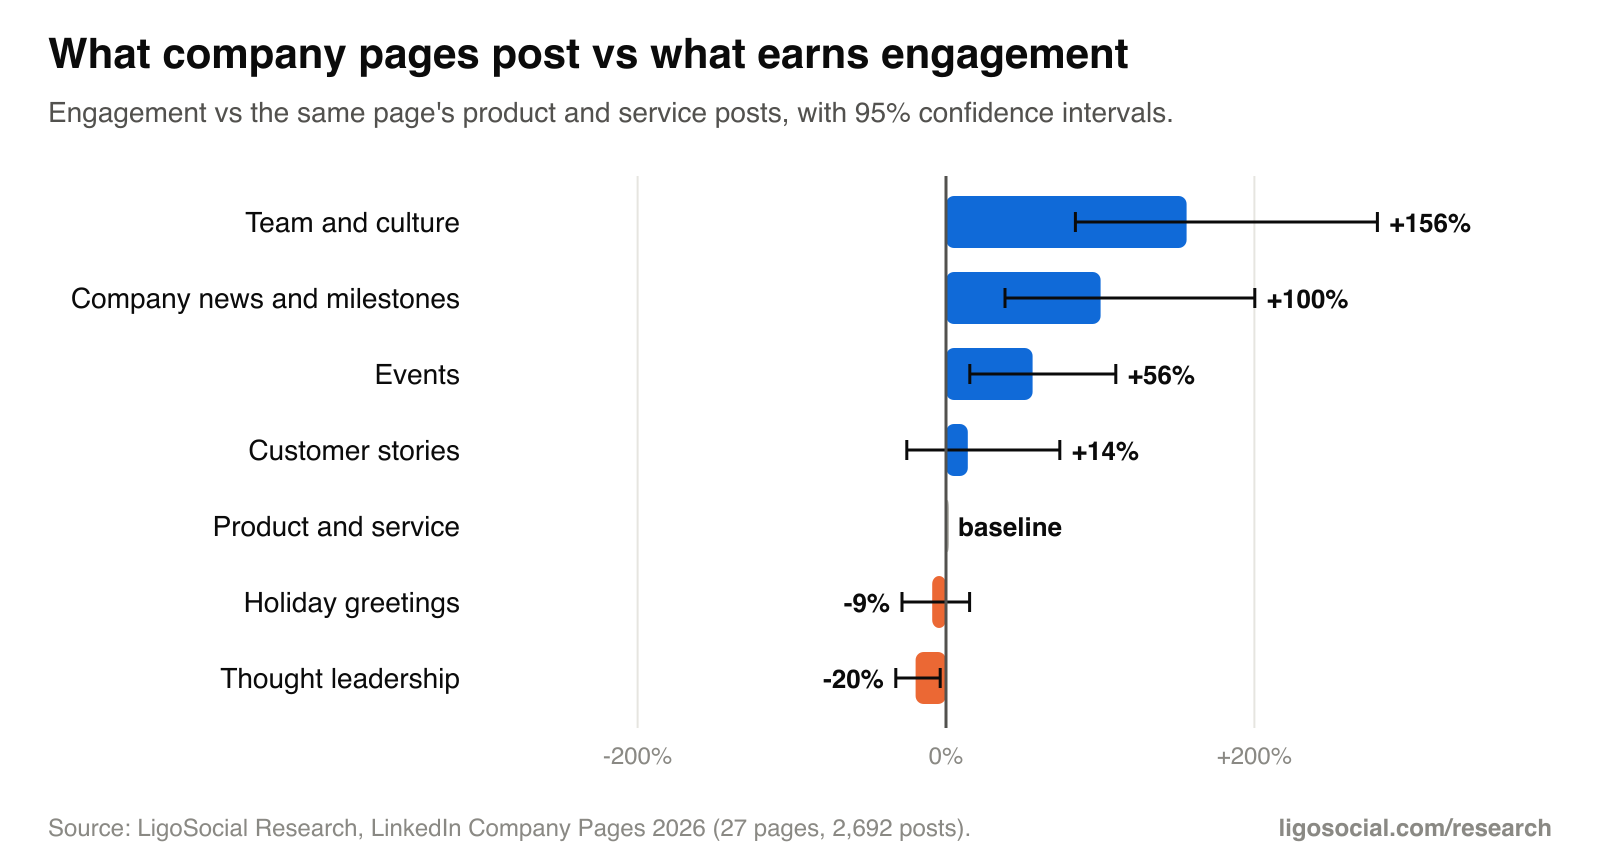
Posts about the team (a new hire, a work anniversary, a team photo, behind the scenes) got +156% vs the same page's product posts (95% CI +84% to +280%) and +80% comments. Only 3.5% of posts are about the team.
+100%
Finding 8
Company news and milestones double engagement
Awards, partnerships, anniversaries, new offices and deals got +100% vs product posts (95% CI +38% to +200%) and +31% comments. They are 3.6% of posts.
+56%
Finding 9
Events beat product posts
Event invitations and recaps got +56% vs product posts (95% CI +15% to +110%). Customer stories came in at +14%, which is not significant; they are only 3% of posts.
+73%
Finding 10
Posts that feature a named person get 73% more
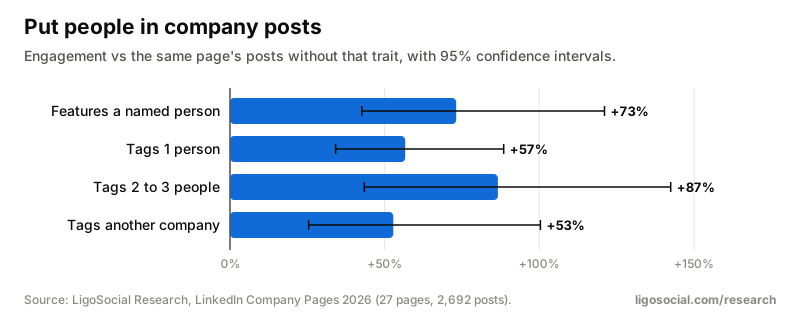
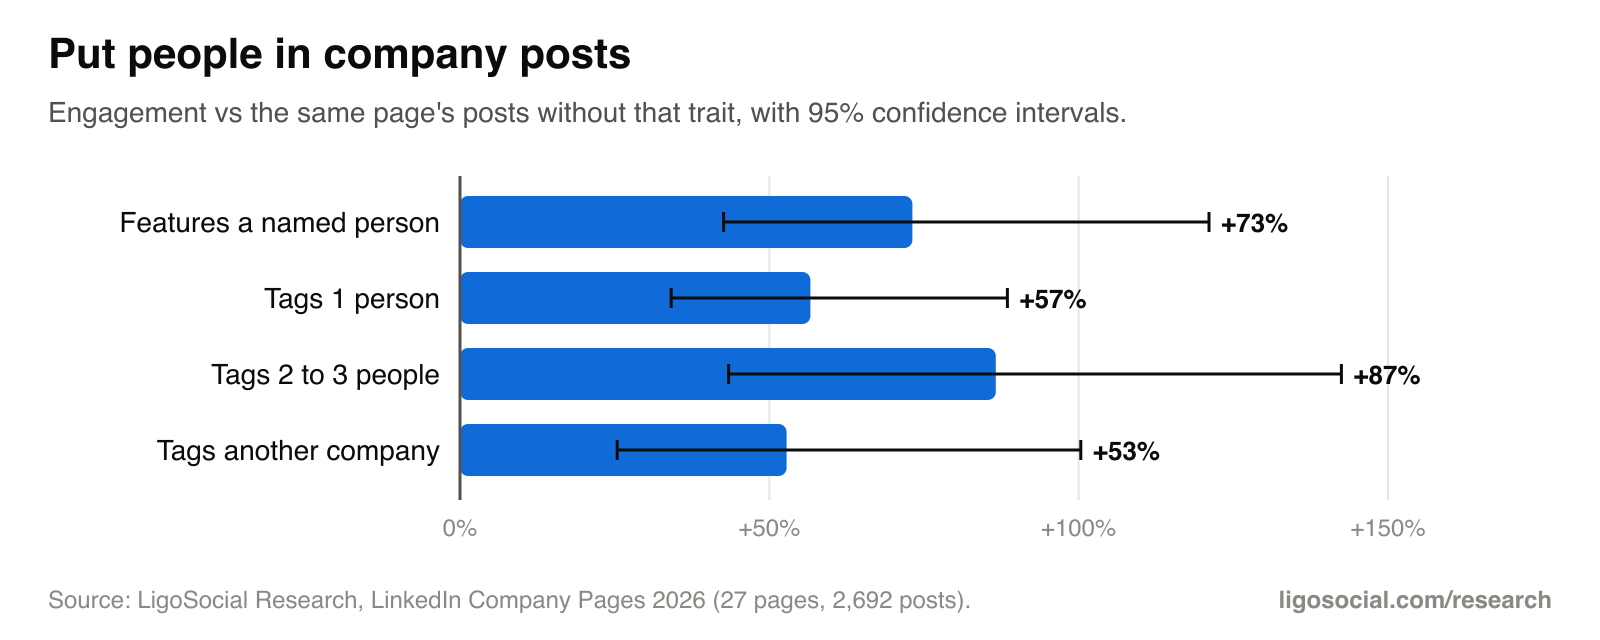
Posts that name or feature a specific person (an employee, a founder, a client, a speaker) got +73% vs the same page's other posts (95% CI +43% to +121%), +41% comments and +19% reposts. Only 25% of company posts do it. The effect grows with page size: +67% at 500 to 1,500 followers, +128% at 1,500+.
+57% to +87%
Finding 11
Tagging people and partners lifts reach
Tagging one person went with +57% engagement and 2 to 3 people +87%, vs the same page's untagged posts. Tagging another company: +53% (95% CI +25% to +100%). Only 12% of company posts tag a person. Tagged people and partners often engage and reshare themselves, which is the point.
-25%
Finding 12
Holiday greetings underperform
Holiday and observance greetings got 25% less than the same page's average post (95% CI -35% to -13%) and 17% fewer reposts than product posts. 20 of 27 pages post them anyway.
Openings and calls to action
-27%
Finding 13
On a company page, news beats opinion
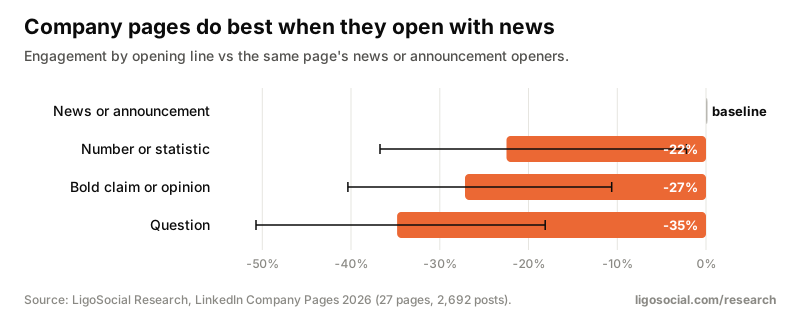
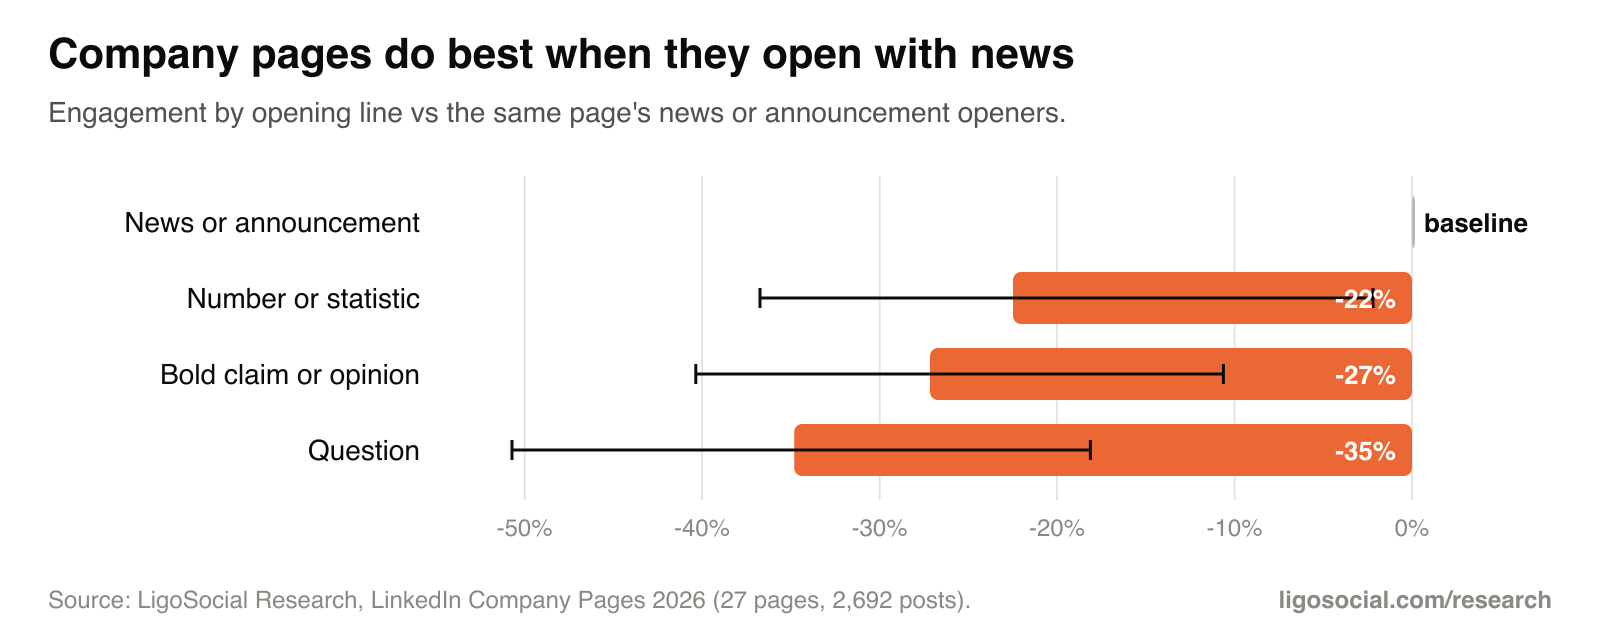
Posts that open with news or an announcement did best. Against them, bold-claim openers got -27% (95% CI -40% to -11%), number or statistic openers -22% and question openers -35%. This is the opposite of personal profiles, where a story opening wins. People follow companies for news.
-11% comments
Finding 14
Asking for comments backfires
Posts that end by asking readers to comment got 11% fewer comments (95% CI -16% to -6%) and 20% less engagement than the same page's other posts. 11% of company posts do it.
-6%
Finding 15
Link and contact requests cost nothing
Posts asking readers to visit a link, register, book or get in touch got -6% vs the same page's other posts (95% CI -25% to +15%), not a significant change. 56% of company posts carry one. The format is what hurts: see link previews below.
AI writing on company pages
73%
Finding 16
Three in four company posts read as AI
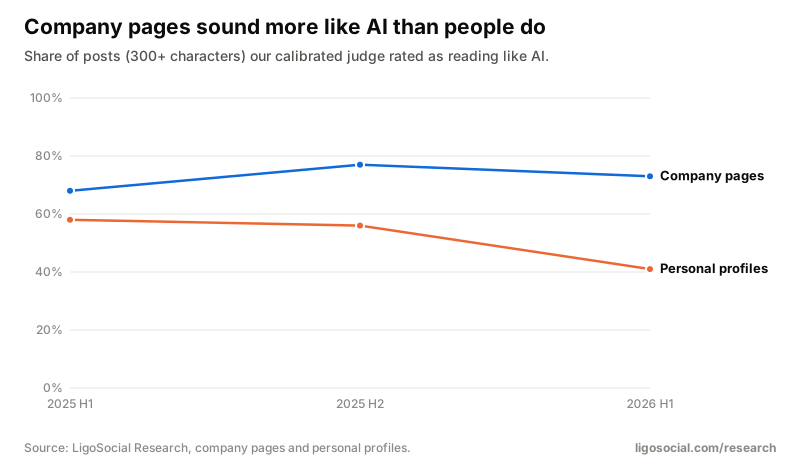
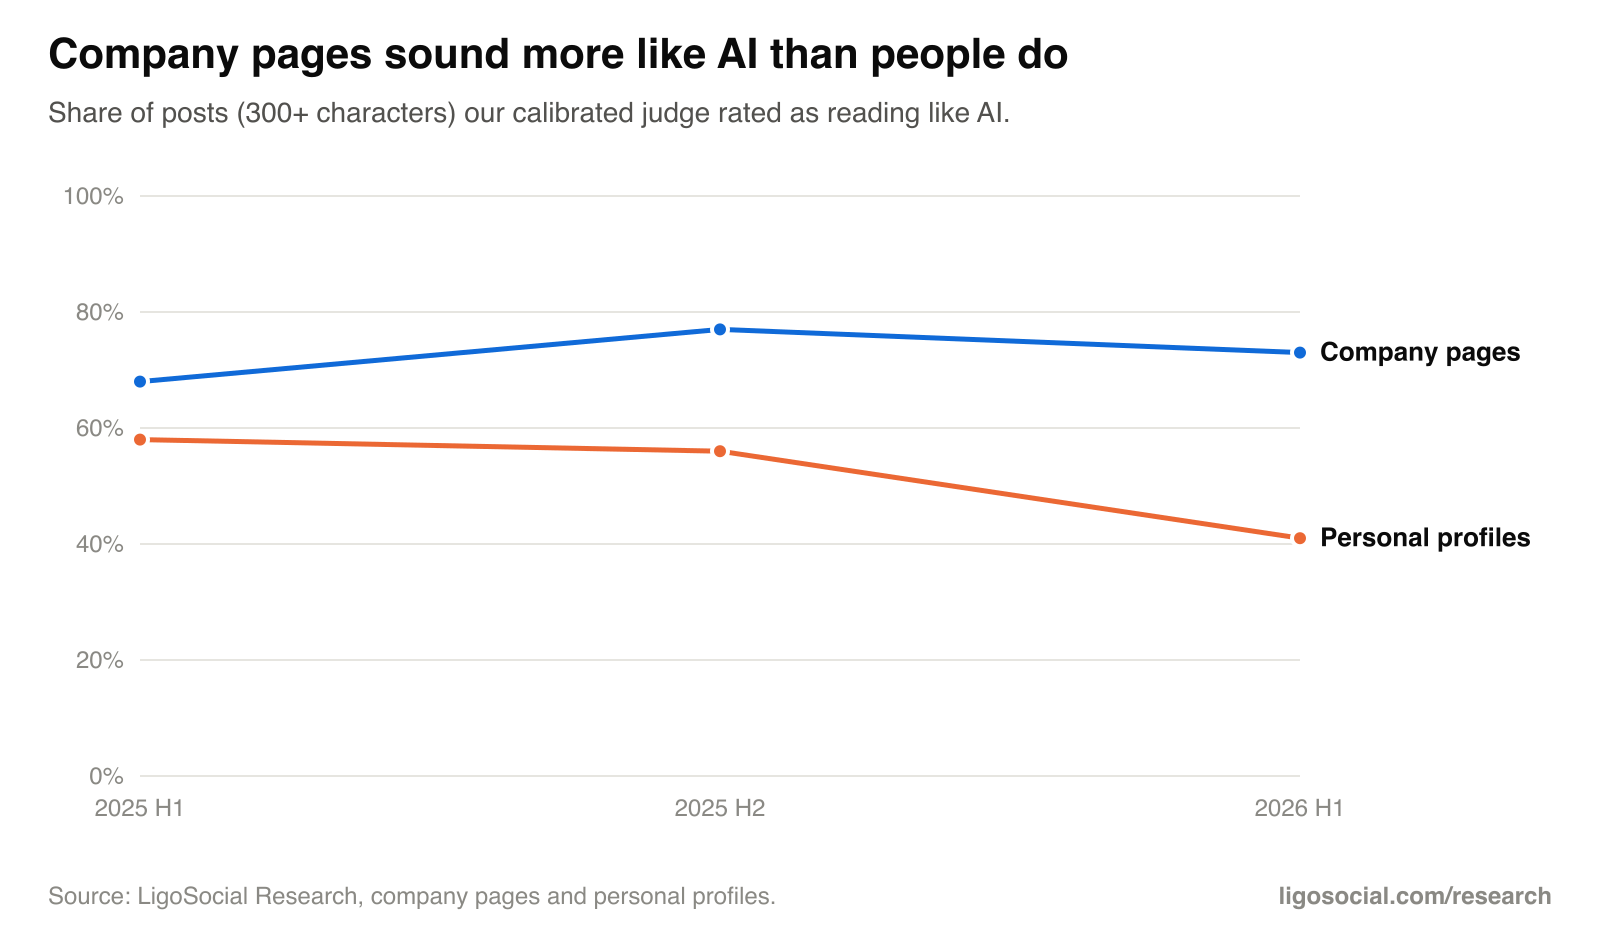
73% of company posts of 300+ characters read as AI to our calibrated judge, against 41% of personal posts in the first half of 2026. 78% of pages publish mostly AI-sounding posts. Em dashes appear in 29% of 2026 company posts (20% for people).
-20%
Finding 17
AI-sounding company posts get 20% less engagement
Posts rated as AI-sounding got 20% less engagement than the same page's other posts (95% CI -30% to -5%) and 9% fewer comments. Comparing only posts of the same content type, the gap shrinks to -7% (CI -17% to +5%): much of the penalty is what AI gets used for, generic thought leadership.
Does your next post read as AI?
Paste it into the free LinkedIn AI Detector. It scores the post and points at the phrases and patterns that give it away. Nothing you paste is stored.
Formats
-30%
Finding 18
Link previews are the weakest format
Link-preview posts got 30% less engagement than the same page's image posts (95% CI -49% to -3%). A URL typed into the body of other posts cost 9% of comments (CI -15% to -3%). 46% of non-link company posts carry a URL.
+58%
Finding 19
Short videos work; documents do not
Videos of 30 to 60 seconds got +58% vs the page's average post (95% CI +19% to +107%); video overall was +11% vs images (not significant) and the most reshared format (+12% reposts). Document carousels got -14% vs images (not significant): company carousels are short (median 5 pages), and in our people study documents only paid off past 10 pages.
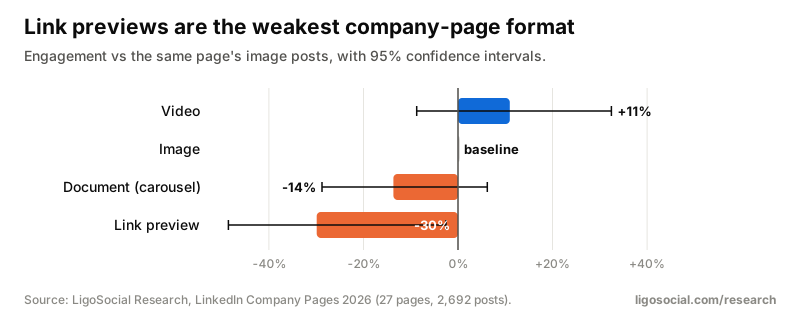
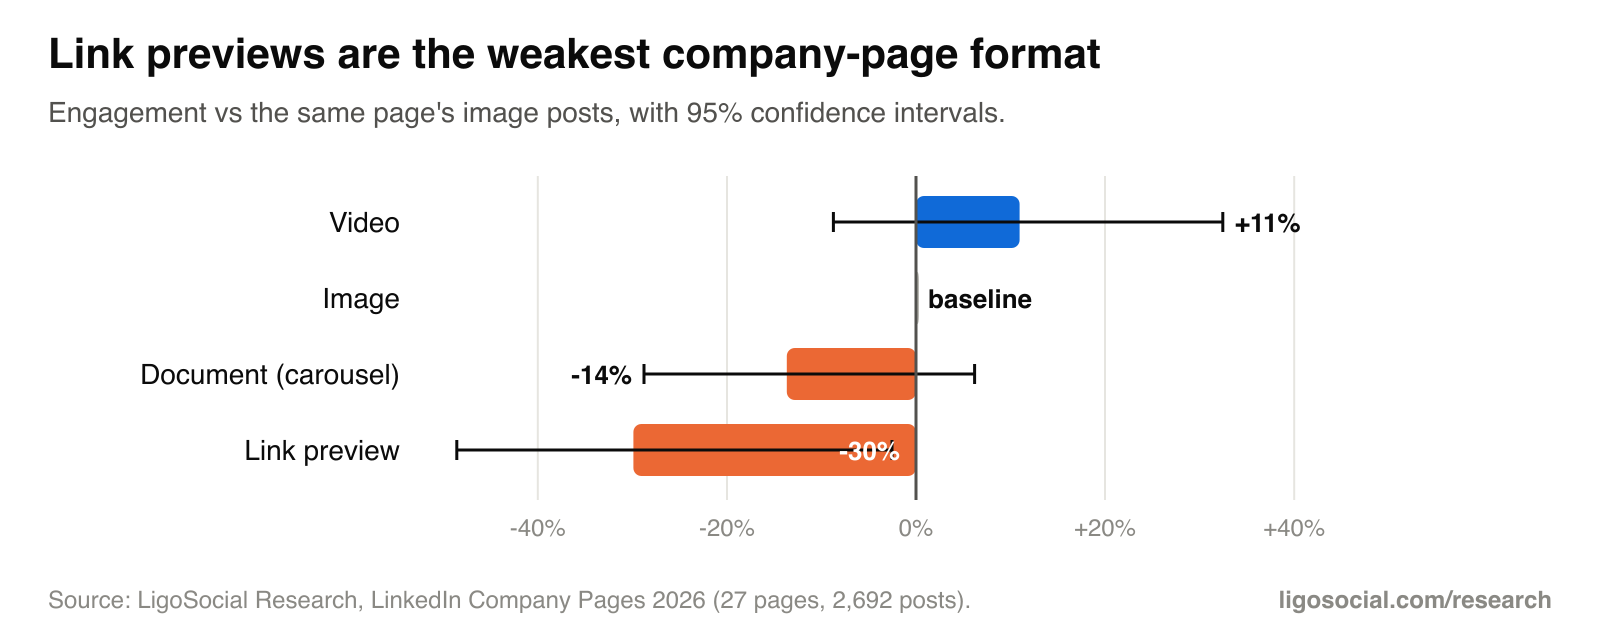
Images are the default (57% of company posts), followed by video (20%), documents (12%) and link previews (9%). Text-only posts are rare on company pages (under 3%, too few to benchmark), and polls under 1%.
Length and hashtags
-15%
Finding 20
Short company posts underperform
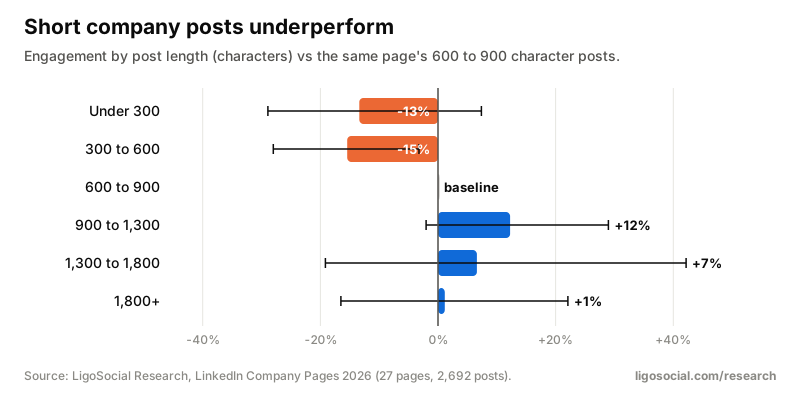
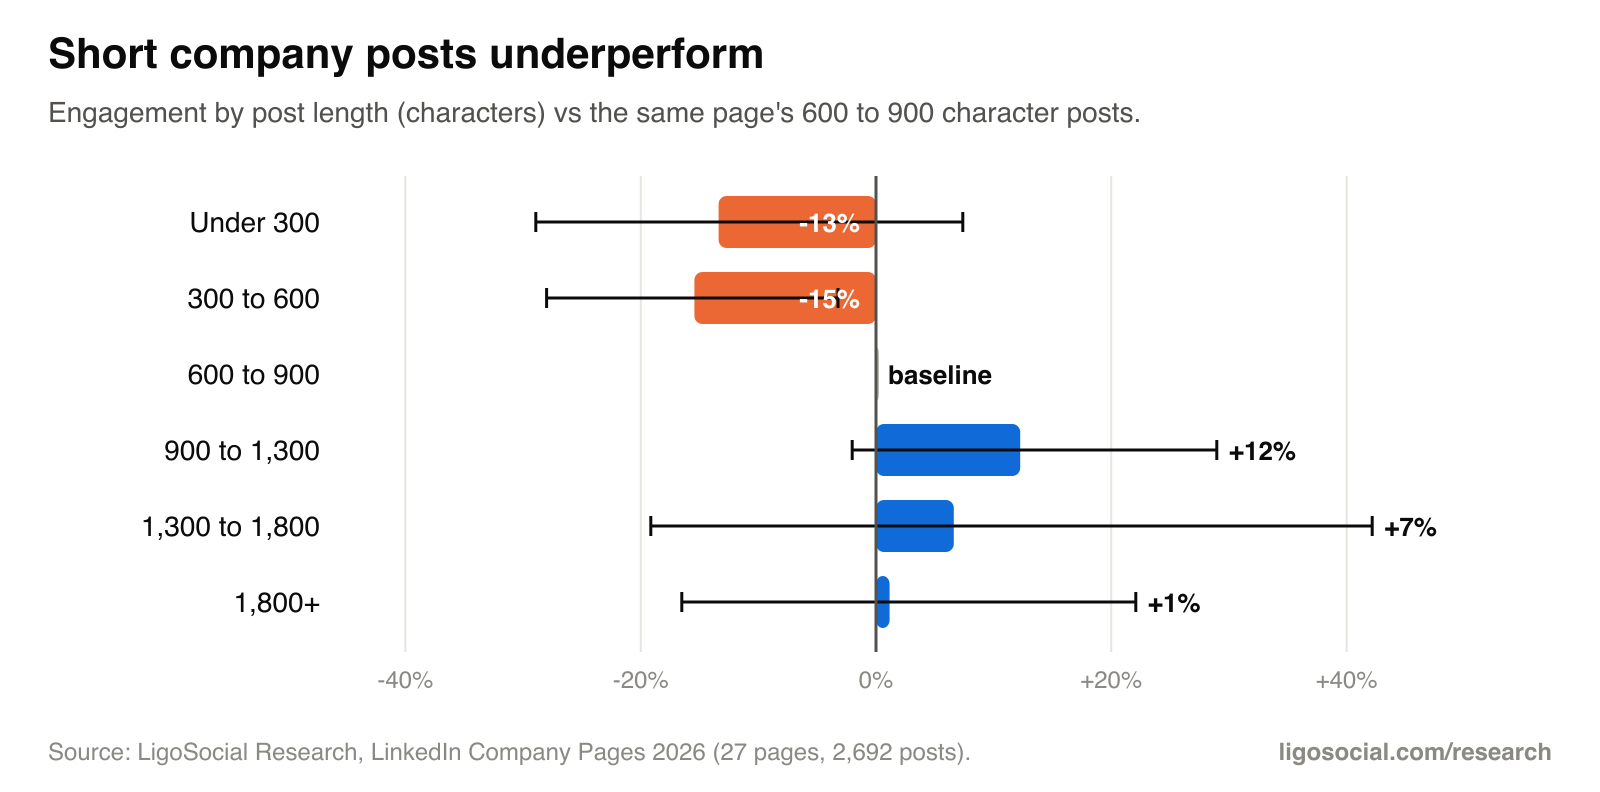
Posts of 300 to 600 characters got -15% vs the same page's 600 to 900 character posts (95% CI -28% to -3%); 900 to 1,300 characters did best (+12%, not significant). The median company post is 690 characters. At 1,500+ followers, posts over 900 characters got +47%.
+32%
Finding 21
Company pages still love hashtags, and a few help
The median company post carries 6 hashtags and 43% carry 7 or more, while most personal posts now use none. Posts with 1 to 3 hashtags got +32% vs the same page's posts with none (95% CI +7% to +63%); 7+ hashtags +25% (not significant).
Timing and frequency
+19%
Finding 22
Afternoon beats early morning
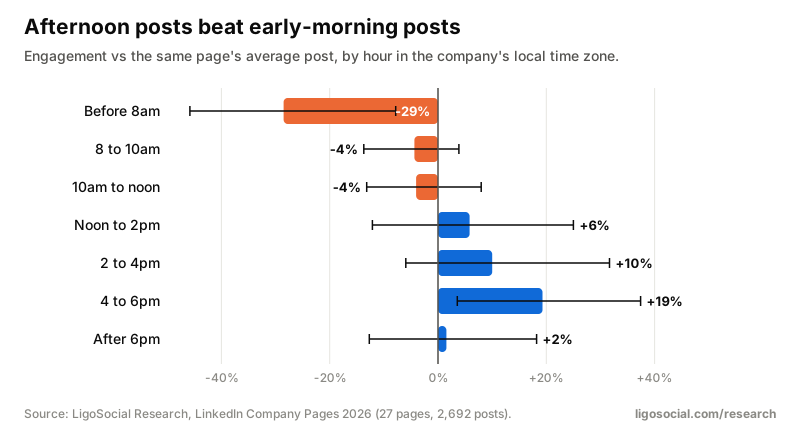
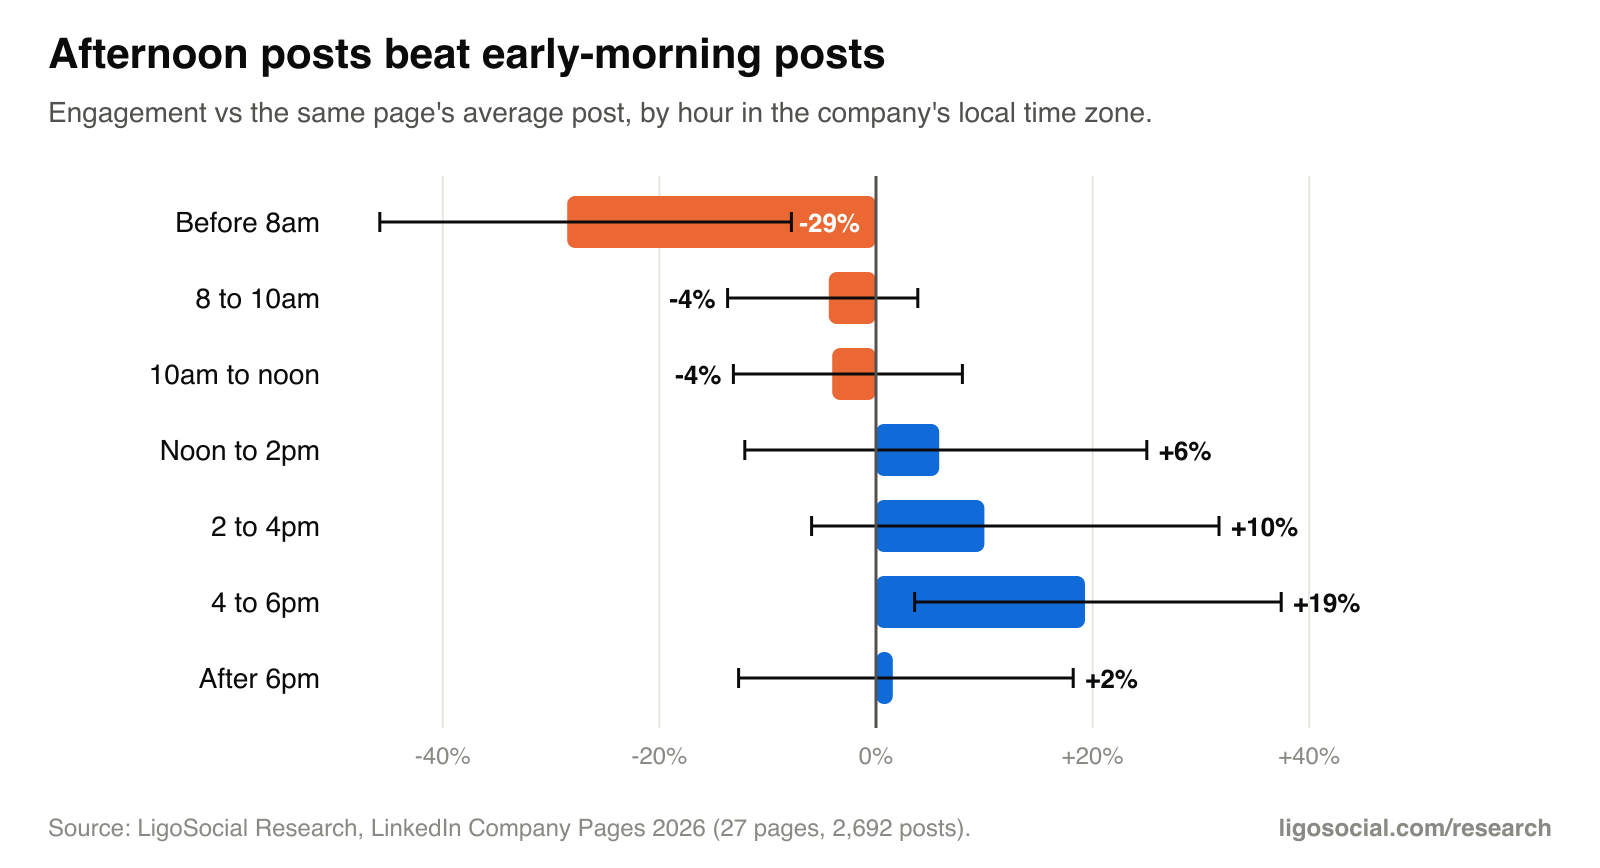
In the company's local time zone, posts at 4 to 6pm got +19% vs the page's average post (95% CI +4% to +37%), while posts before 8am got -29% (CI -46% to -8%). 10am to noon is the most common slot (27% of posts) and sits at -4%.
93%
Finding 23
Weekdays are fine; weekends are untested
93% of company posts go out Monday to Friday, and no weekday stands out (all within 7% of average). Weekend posts got +7% (95% CI -4% to +21%), not a significant difference.
-4%
Finding 24
Posting more often did not cost per-post engagement
In weeks with 5+ posts, each post got -4% vs single-post weeks (95% CI -24% to +20%): no clear penalty. The typical page posts about 3 times a month and is active in only 40% of weeks.
What works at each follower count
Same method inside each band: each effect compares posts on the same page. Bands follow natural breaks in the follower counts of the pages we selected.
Follower band 1 of 3
100 to 500 followers
9 authors, 790 posts
What worked
- Posting between 2 and 6pm local time: +18% vs the same page's other posts (95% CI +2% to +37%).
- Product and service posts held up best here: +16% vs other posts (CI -1% to +39%).
- Link and contact requests did not hurt (+6%, not significant).
What did not
- Thought leadership, 46% of posts at this size, earned -9% vs other posts (not significant) and no extra comments.
- Asking for comments: -7% (not significant).
- Typical post: 2 engagements, and the typical page gets no reposts at all.
Do this
- Show the product and the people who make it; save opinion pieces for founders' own profiles.
- Schedule for the afternoon, not before work.
- Ask two or three teammates to reshare each post: at this size reposts are the missing piece.
Follower band 2 of 3
500 to 1,500 followers
10 authors, 714 posts
What worked
- Event posts: +92% vs other posts (CI +49% to +164%).
- Opening with news: +90% vs other openings (CI +49% to +137%).
- Featuring a named person: +67% (CI +32% to +109%). Video: +44% (CI +7% to +100%).
- 1 to 3 hashtags: +64% vs none (CI +17% to +120%); 900+ characters: +17% (CI 0% to +37%).
What did not
- Link previews: -52% vs other formats (CI -77% to -24%). A URL in the body: -26% (CI -39% to -11%).
- Thought leadership: -40% (CI -59% to -12%), yet it is 42% of posts.
- AI-sounding posts: -25% (CI -41% to -2%). Asking for comments: -29% (CI -49% to -6%).
Do this
- Lead with news: events, launches, wins, new people.
- Put the link in the first comment or skip it; keep the post native.
- Film short videos of real people; use a few hashtags, not a wall of them.
Follower band 3 of 3
1,500+ followers
8 authors, 1,188 posts
What worked
- Featuring a named person: +128% vs the same page's other posts (CI +51% to +274%). 41% of posts at this size already do.
- Longer posts (900+ characters): +47% (CI +14% to +96%).
- Opening with news: +56% (CI +17% to +129%).
What did not
- Thought leadership: -45% (CI -63% to -22%).
- AI-sounding posts: -21% (CI -32% to -9%).
- Product and service posts: -23% vs other posts (CI -44% to 0%).
Do this
- Make people the story: the engineer who shipped it, the client who used it, the new hire.
- Write the full story (900+ characters) instead of a caption plus a link.
- Edit AI drafts until they sound like your team; at this size readers notice.
Method and limits
Engagement is reactions + comments + reposts, read at least 7 days after posting. Within-page effects compare each post with the same page's other posts on a log scale, average per page, then across pages, so every page counts once. Confidence intervals come from resampling pages (1,000 draws for trends, 400 for effects). Local time uses the company's headquarters time zone (23 of 27 pages).
Content type, opening, "reads as AI", named people and calls to action were labelled for all 2,692 posts by a calibrated AI judge (Jev by TypeSafe), with the same "reads as AI" question as our people study.
| Question | Result | Threshold |
|---|---|---|
| Content type (10 options) | 88% agreement (69 of 78 posts); 92% on unambiguous posts | most likely option |
| Reads as AI | AUC 0.91 (calibration) and 0.93 (held-out set); 91% precision | score under 0.5 of 3 |
| Features a named person | AUC 0.99, 94% accuracy | 0.5 |
| Asks readers to comment | AUC 0.99, 96% accuracy | 0.9 |
| Link or contact request | AUC 0.91, 92% accuracy | 0.9 |
78 randomly drawn posts labelled by hand (48 for calibration, 30 held out after the definitions were fixed). Every post in the study was labelled; no post failed.
- A focused sample, not all of LinkedIn. 27 pages is enough to see large, consistent effects inside pages, not to rank industries or countries. Small effects are reported as not significant rather than guessed at.
- Small and mid-size pages. The median page has about 1,000 followers and 9 in 10 list fewer than 50 employees. Pages with 100,000+ followers behave differently and are not the focus here.
- Views, clicks and follows. We see reactions, comments and reposts only. A link post may lose engagement and still send the traffic you want.
- Causation. Comparing posts on the same page removes most noise (audience size, industry, brand), but teams choose what to post, and a big announcement can drive both the format and the result.
- Judged labels. Content types, openings and "reads as AI" come from a calibrated AI judge checked against hand labels (see below). It is accurate, not perfect.
- AI levels. The teams behind these pages use an AI writing assistant, so the share of AI-sounding posts is likely higher than across all company pages. The within-page penalty travels better than the level.
Post what the data says works, in your own voice
LigoSocial learns how you write from your own LinkedIn posts, then drafts posts, comments and replies in that voice right inside LinkedIn. You approve what goes out.
Add LigoSocial to ChromeOr try it at ligosocial.comCommon questions
- What is a good engagement rate for a LinkedIn company page?
- For small and mid-size pages, the typical post earns about 0.48% of followers in reactions, comments and reposts; the top quarter of pages reach 1.1%. Smaller pages have higher rates: 0.74% at 100 to 500 followers vs 0.29% at 1,500+.
- What should a company post on LinkedIn?
- Posts about people. Team and culture posts got +156% vs product posts, company news and milestones +100%, and events +56%. Posts featuring a named person got +73%. Generic thought leadership, the most common company post, was the weakest (-24%).
- What is the best time to post on a LinkedIn company page?
- Afternoon in your local time zone: 4 to 6pm got +19% vs the page's average post, while posts before 8am got -29%. Weekdays all performed about the same.
- Do LinkedIn company pages get less engagement than personal profiles?
- Per follower, pages with 1,000 to 3,000 followers match personal profiles (0.42% vs 0.43%). The big difference is comments: 4% of company-page engagement vs 20% for people.
- Should company pages use AI to write LinkedIn posts?
- 73% of company posts already read as AI, and those posts got 20% less engagement than the same page's other posts. Use AI for drafts, then add names, specifics and your team's voice.
Download the data
Suggested citation
LigoSocial Research (2026). LinkedIn Company Pages 2026: what works for small and mid-size brands. https://ligosocial.com/research/linkedin-company-pages-2026
Free to reuse under CC BY 4.0: quote the numbers, embed the charts or rework the data, with credit to LigoSocial Research and a link to this page. Every figure is aggregated and anonymised; no individual, profile or post can be identified.
How we collect, clean and anonymise the data: methodology. Questions or a cut we have not published? Ask us.
Related research
- ReportLinkedIn company page engagement rate benchmarks 2026The typical company post earns 0.48% of followers; benchmarks by follower band and vs personal profiles.
- ReportBest time to post on a LinkedIn company page: 2,460 posts in local time4 to 6pm local time +19%, before 8am -29%; weekdays are all about the same; posting more did not hurt.
- ReportWhat to post on a LinkedIn company page: content types ranked by engagementTeam posts +156% and news +100% vs product posts; thought leadership, the most common post, -24%.
- Annual reportThe State of LinkedIn 2026: what works for everyday professionals40 findings from 134,522 posts, plus what works at each follower count.
- ReportLinkedIn post formats compared: images, carousels, video, text, links and pollsImages +36%, link previews -15%, polls -50%. Carousels only pay past 10 pages.
- ReportDo AI-written LinkedIn posts get less engagement?AI-sounding posts get 22% less engagement, and the share of them peaked in 2024 to 2025.