
Key findings
- Posts that read as AI got 22% less engagement than the same author's human-sounding posts, and AI-sounding posts peaked from late 2024 through 2025. Read the AI study.
- Stories beat advice by 39%, and a story opening beats a bold claim by 33%. Question openers and "What do you think?" endings do not add comments.
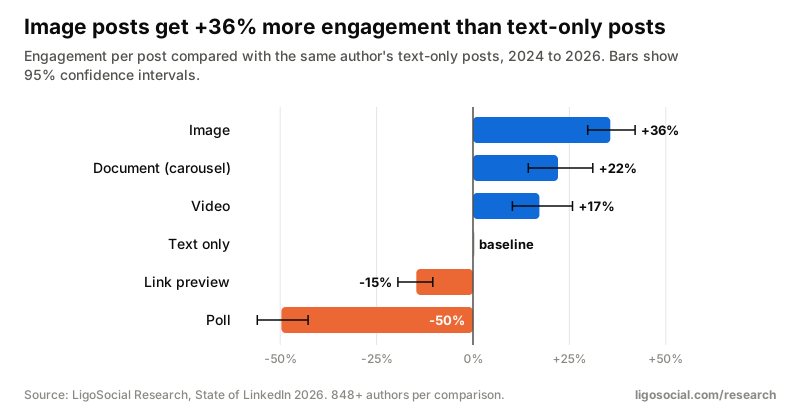
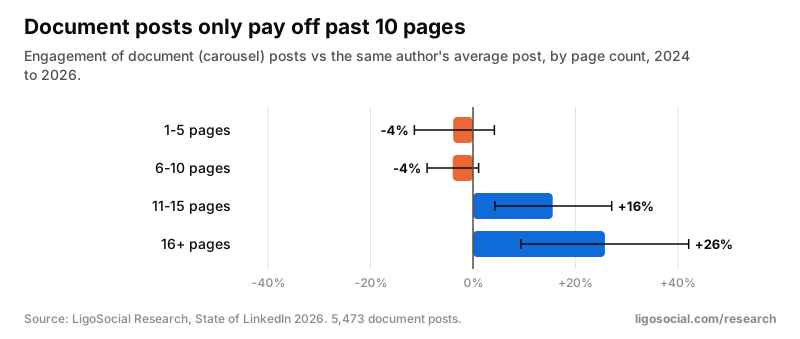
- Images beat text by 36%; link previews lose 15% and polls 50%. Documents only pay off past 10 pages. Formats.
- Longer posts win: 2,400+ characters got +24% vs 600 to 900. Length.
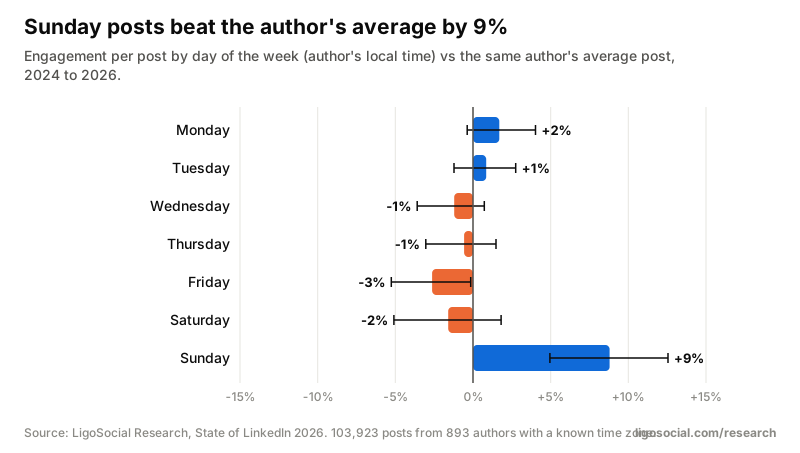
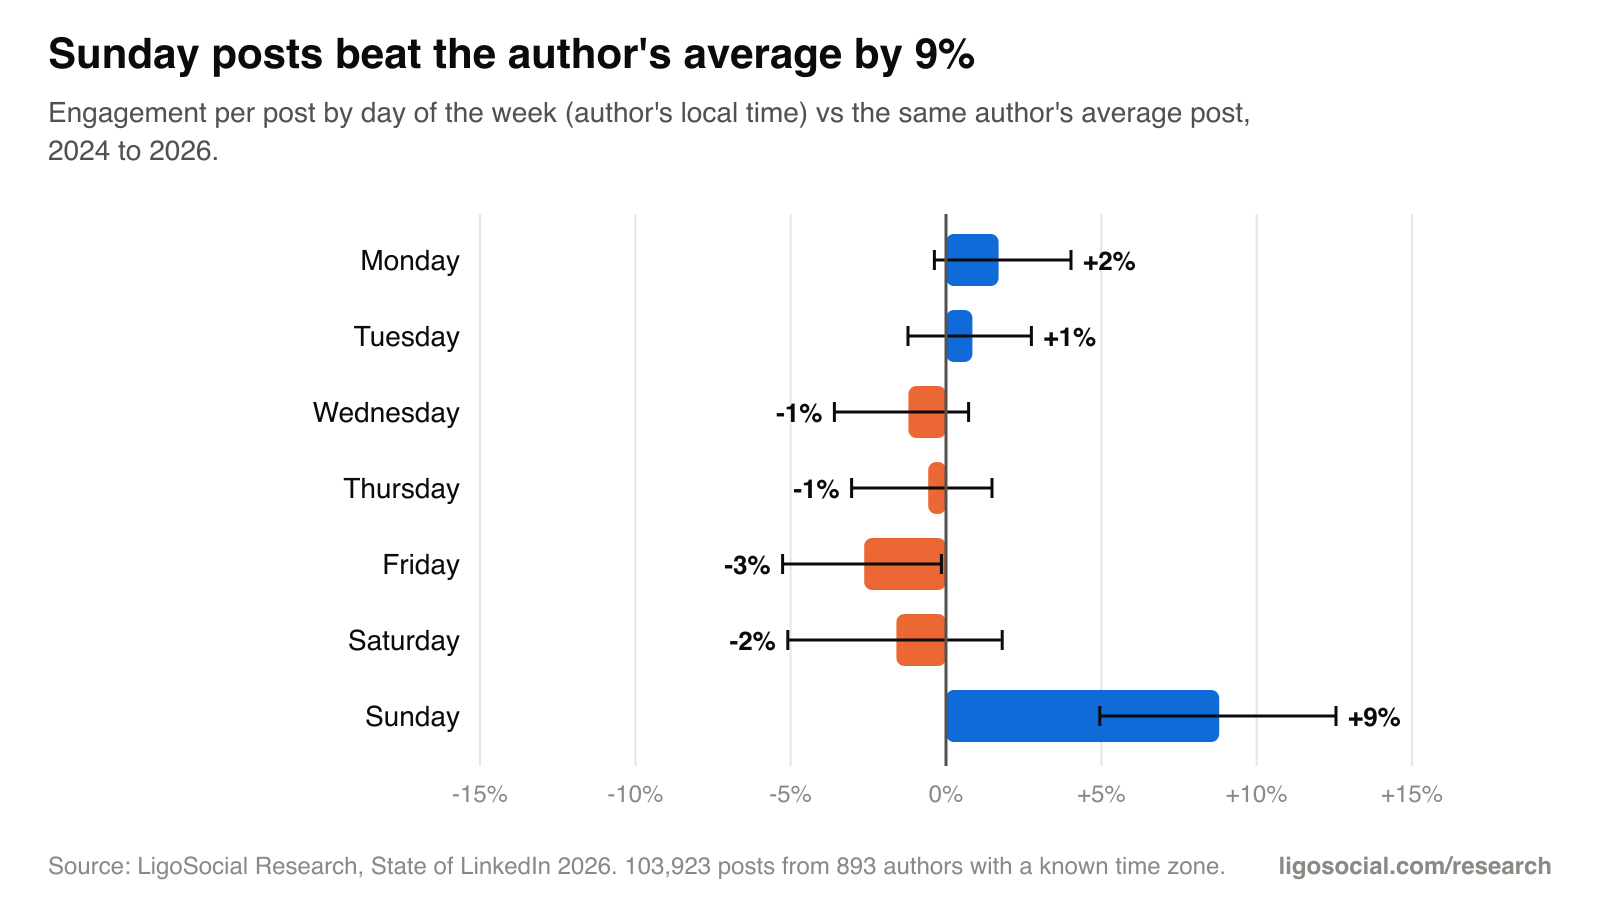
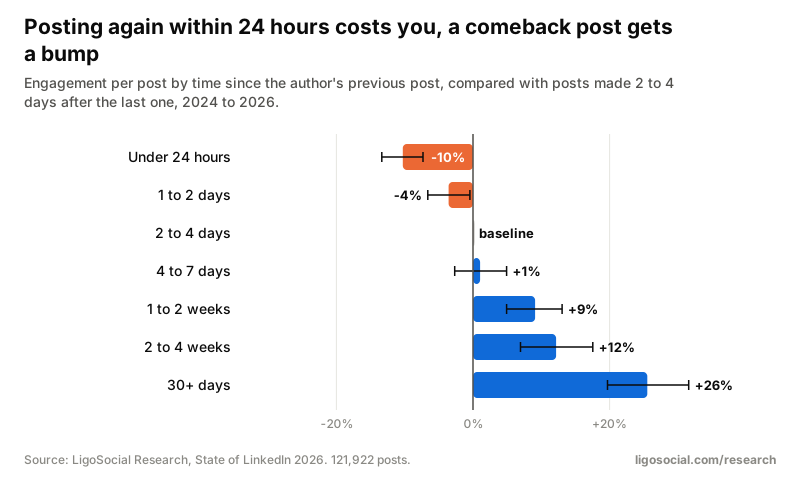
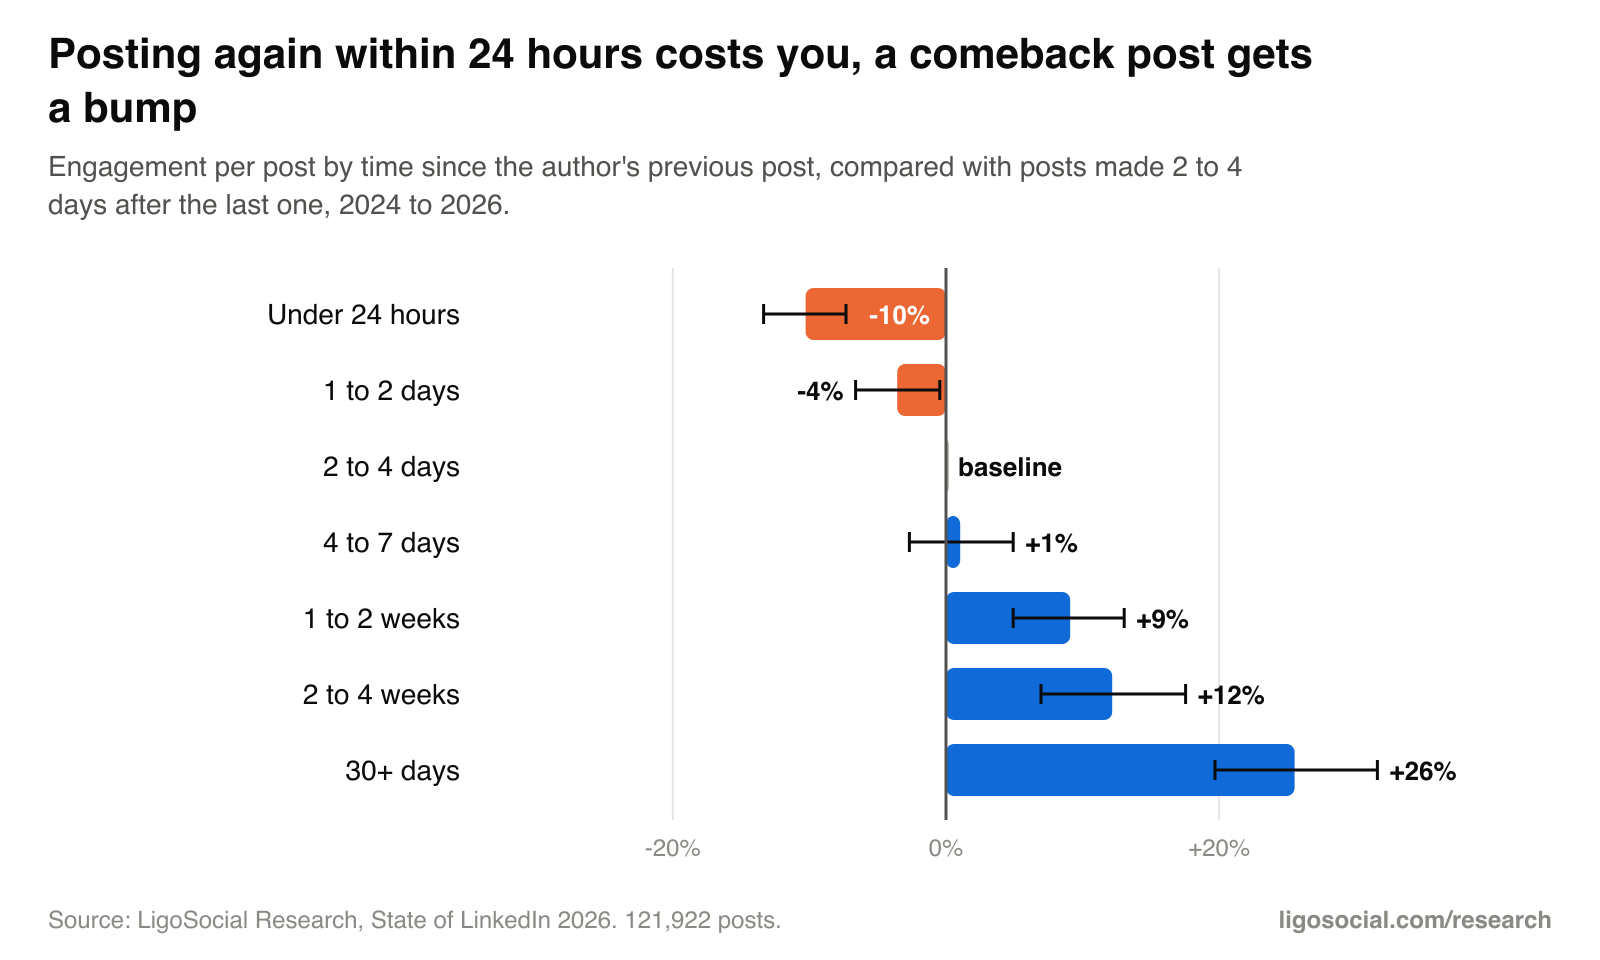
- Sunday is the best day (+9%) and the hour barely matters. Posting twice in 24 hours costs the second post 10%. Timing.
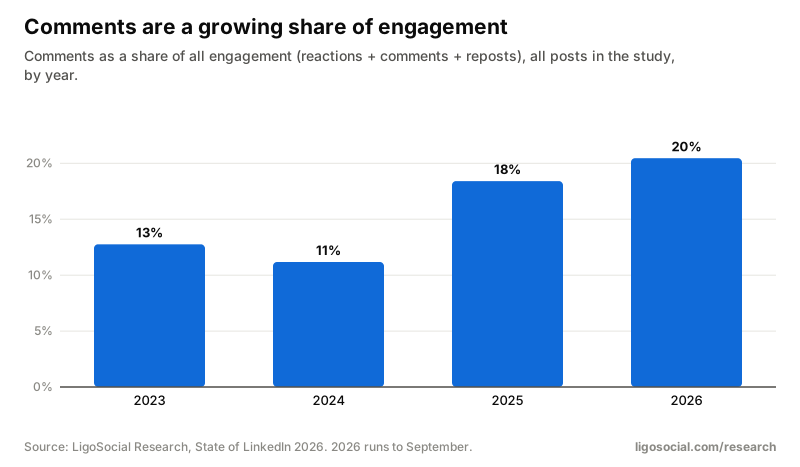
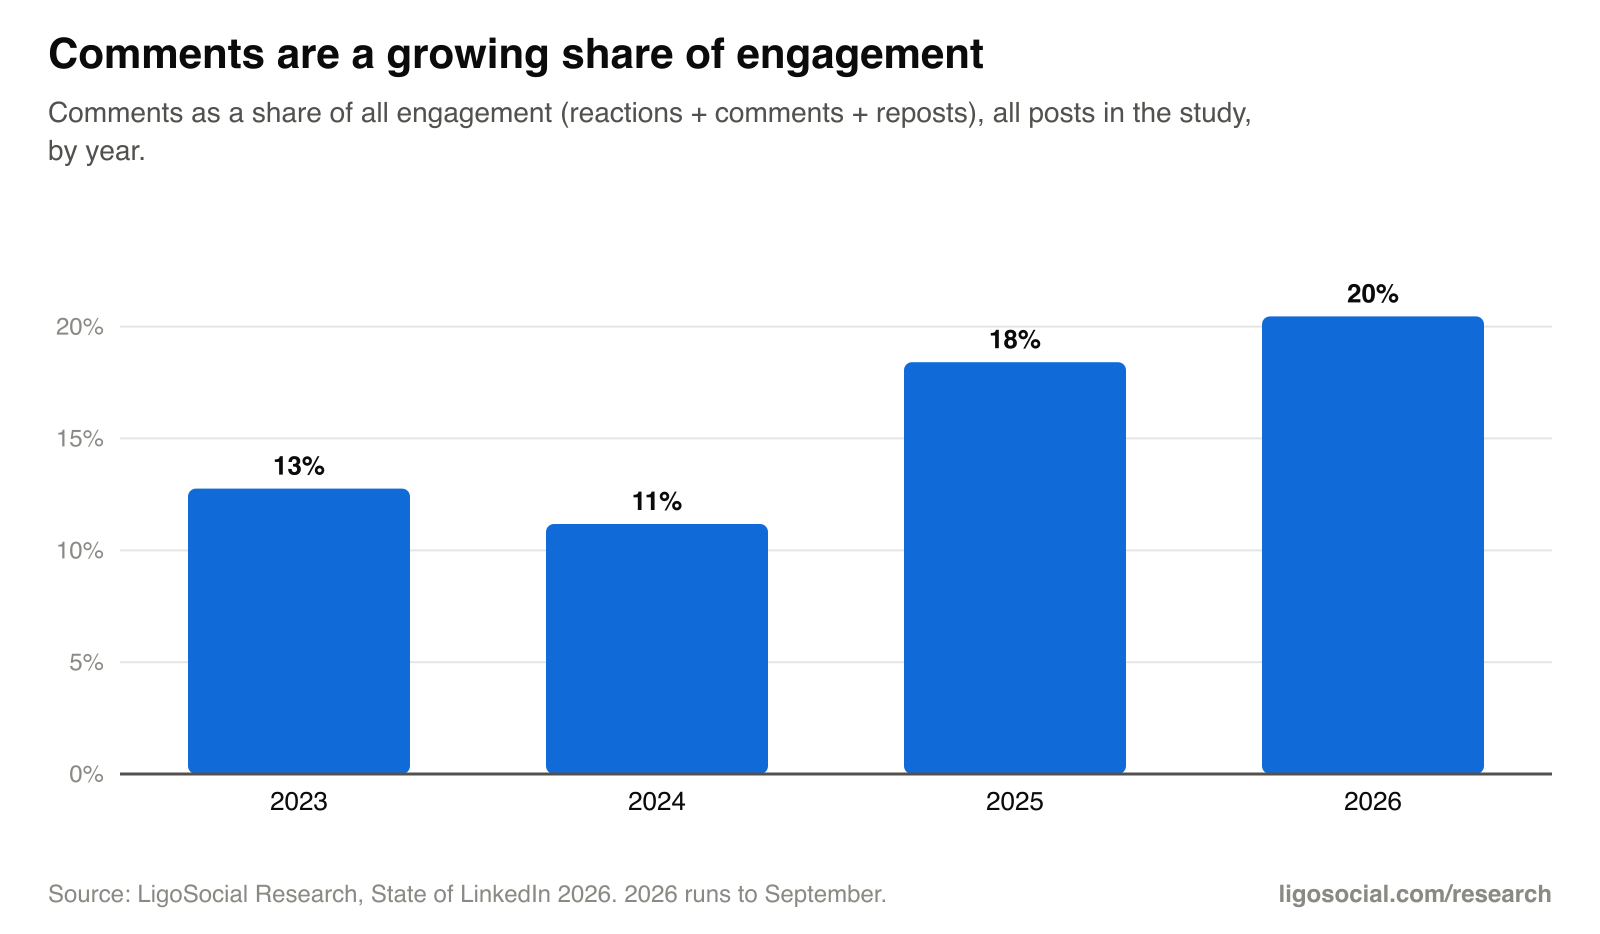
- Engagement did not collapse for everyday accounts: +6% per post in 2025 vs 2024 for the same people, and comments grew to 20% of all engagement. Benchmarks.
- Consistency drives growth: people who posted in 75%+ of weeks grew 2.7% a month vs 1.0%. How often to post.
- Tagging real people lifts engagement +35% to +126%; hashtags and emojis barely matter. Hashtags.
Contents
- 1About this report
- 2AI writing: the penalty and the peak
- 3What to write
- 4Formats
- 5Length, hashtags, emojis and tags
- 6Timing and cadence
- 7Trends and benchmarks
- 8Follower growth
- 9Industries and regions
- 10What works at each follower count
- 11Under 1,000 followers
- 121,000 to 3,000 followers
- 133,000 to 6,000 followers
- 146,000 to 10,000 followers
- 1510,000+ followers
- 16What this data cannot tell you
About this report
LinkedIn advice is full of confident rules built on big creators, brand pages or one person's hunch. We wanted to know what actually works for ordinary professionals: founders, consultants, recruiters, engineers and marketers with a few hundred to a few thousand followers.
This report analyses 134,522 public LinkedIn posts from 1,499 real profiles of LigoSocial users who connected their own account, posted between January 2023 and September 2026. The median author has about 2,000 followers. Every number is an aggregate over many people; we never publish names, handles or post text.
Two things make it different from the paid industry reports. First, every effect is measured inside the same author's own posts, so a handful of big accounts cannot drive the result: we ask "does the same person do better when they post an image instead of text?", not "do image posters have more followers?". Second, we report results by follower band, because what works at 800 followers is not always what works at 15,000.
AI writing: the penalty and the peak
-22%
Finding 1
Posts that read as AI get less engagement
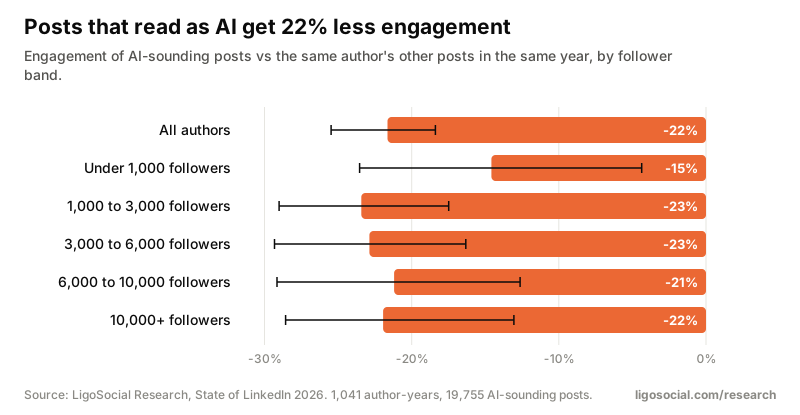
Comparing posts by the same author in the same year, posts our calibrated judge rated as AI-sounding got 22% less engagement than that author's other posts (95% CI -25% to -18%). Comments fell by a similar amount (-19%).
+31%
Finding 2
Clearly human posts get a premium
Posts rated clearly human (a score of 1.5 or more out of 3) got 31% more engagement than the same author's other posts that year (95% CI +23% to +39%). The more human the post read, the better it did, step by step.
-15% / -16%
Finding 3
The AI penalty is not a topic or format effect
The gap holds when we only compare posts of the same type (-15%), the same topic (-16%), or the same format and length (-16%) by the same author in the same year. AI-sounding posts are not losing just because they cover duller subjects.
44% to 59% to 41%
Finding 4
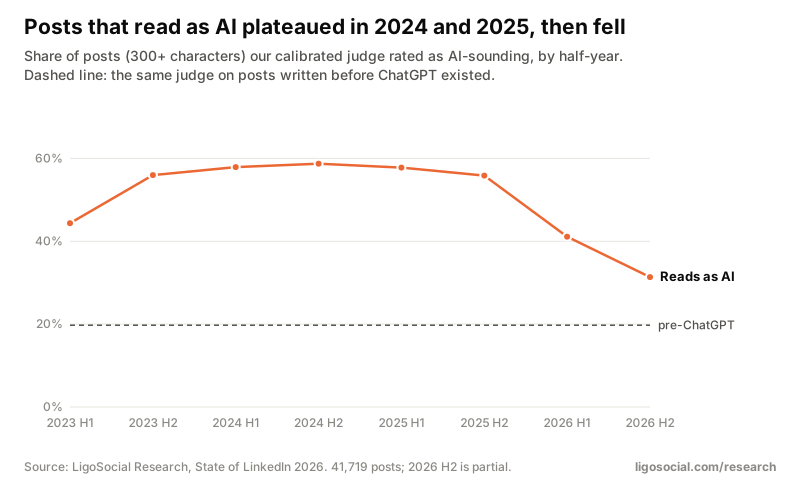
AI-sounding posts plateaued in 2024 and 2025, then fell
The share of posts that read as AI went from 44% in early 2023 to 59% in late 2024 and stayed near that level through 2025 (58% and 56%), then fell to 41% in the first half of 2026. The same judge flags 20% of posts written before ChatGPT existed, which is its false-positive floor, so the real excess peaked at about 39 points.
3.5% to 26%
Finding 5
Em dashes went up sevenfold, then fell
Posts with at least one em dash: 3.5% in 2023, 26% in 2025, 20% in 2026. In a fixed panel of 345 people who posted in both 2023 and 2025, the share who used one in at least 1 post in 5 went from 5% to 53%, then down to 35% in 2026.
+7%
Finding 6
The em dash itself is not what readers punish
Posts with an em dash got +7% engagement vs the same author's posts without one (95% CI +3% to +10%). The dash is a marker that often travels with AI text, not the cause of the penalty. Deleting dashes from an AI draft does not make it read human.
1.3% to 9.6%
Finding 7
People dropped the famous AI words but kept the AI structures
"Delve", "game-changer" and "ever-evolving landscape" fell from 4.2% of posts in 2023 to 0.5% in 2026. Over the same years "Here's why" style set-ups rose from 1.3% to 9.6%, "It's not X, it's Y" contrasts from 1.2% to 5.9%, and arrow bullets from 0.6% to 12.3%. Writers learned to delete the words everyone mocks, not the rhythm that gives AI away.
Does your next post read as AI?
Paste it into the free LinkedIn AI Detector. It scores the post and points at the phrases and patterns that give it away. Nothing you paste is stored.
What to write
+39%
Finding 8
Stories beat advice
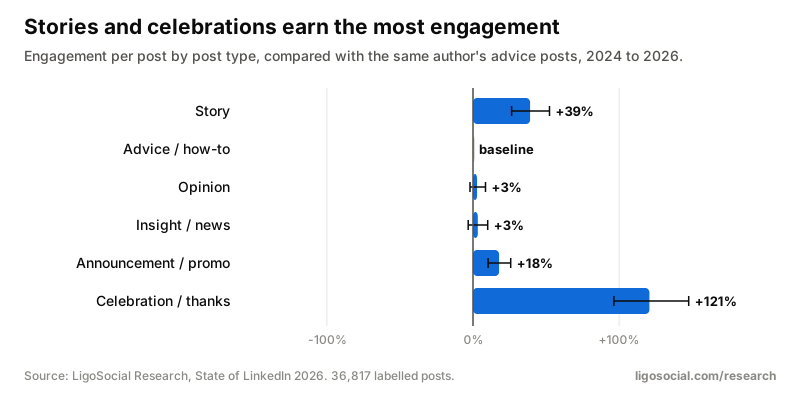
Story posts (a specific moment or experience) got 39% more engagement than the same author's advice posts (95% CI +26% to +52%). Celebration and thank-you posts did best of all (+121%) and announcements got +18%, while opinions (+3%) and insight or news posts (+3%) did no better than advice. Advice is the most common post type in our data (27% of posts); stories are only 9%.
+72% comments
Finding 9
People comment on moments and share what they can use
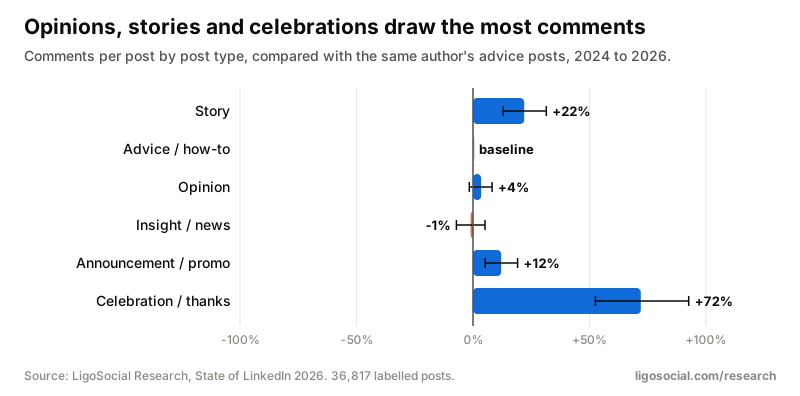
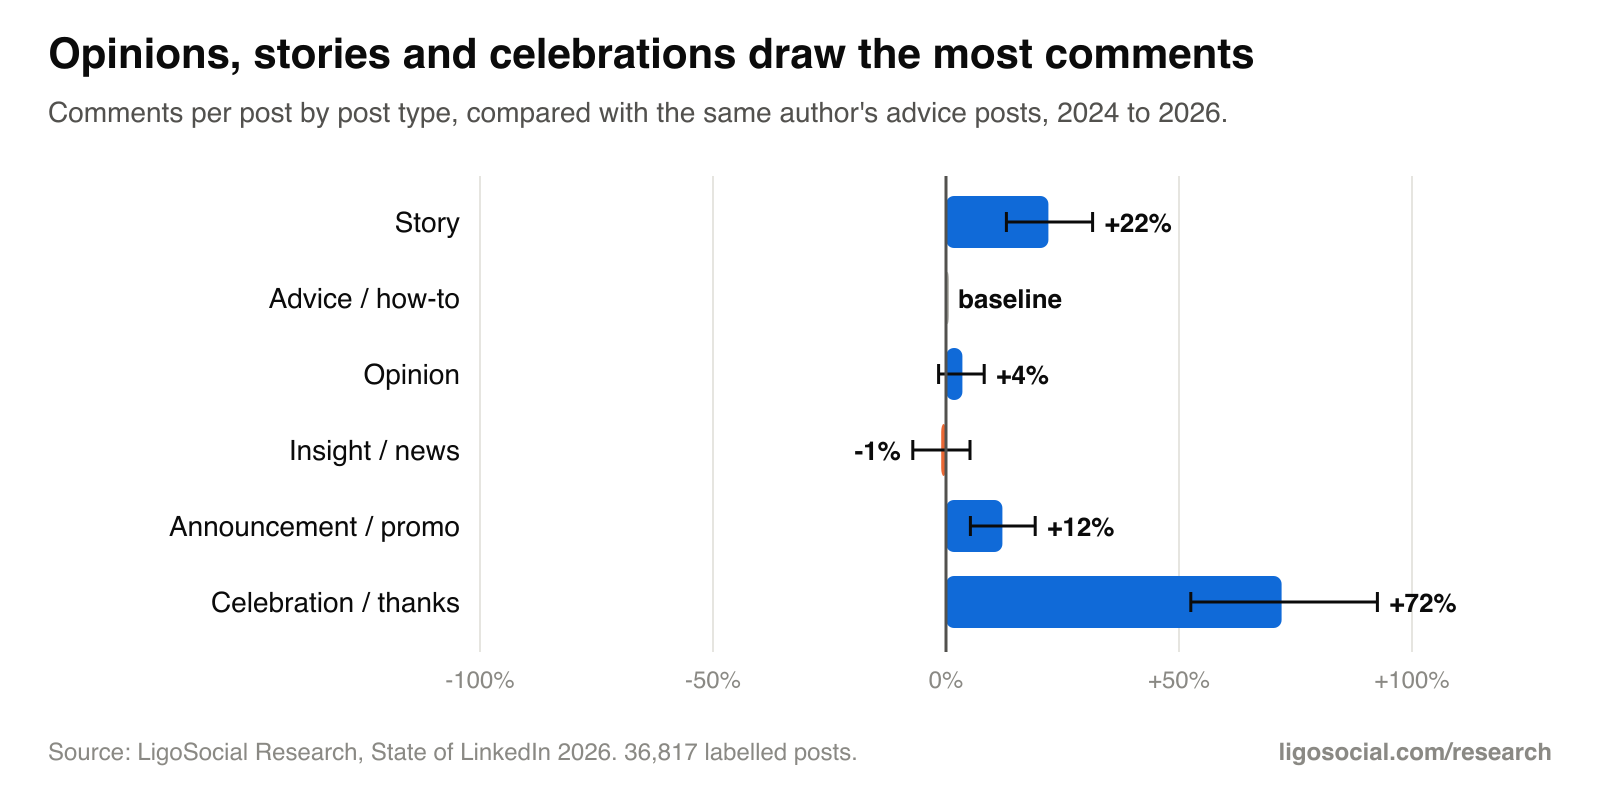
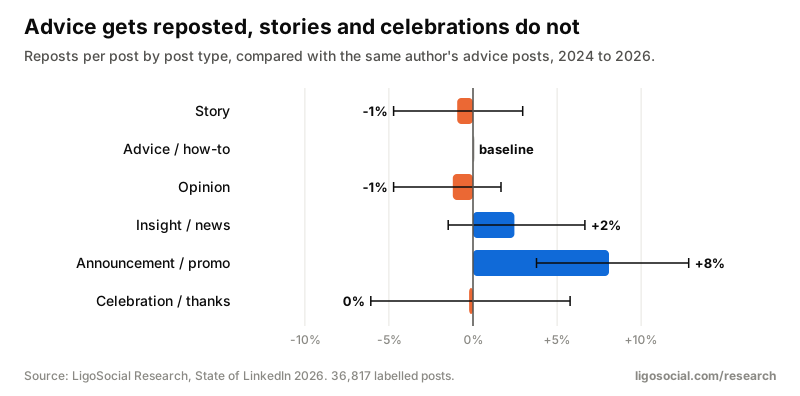
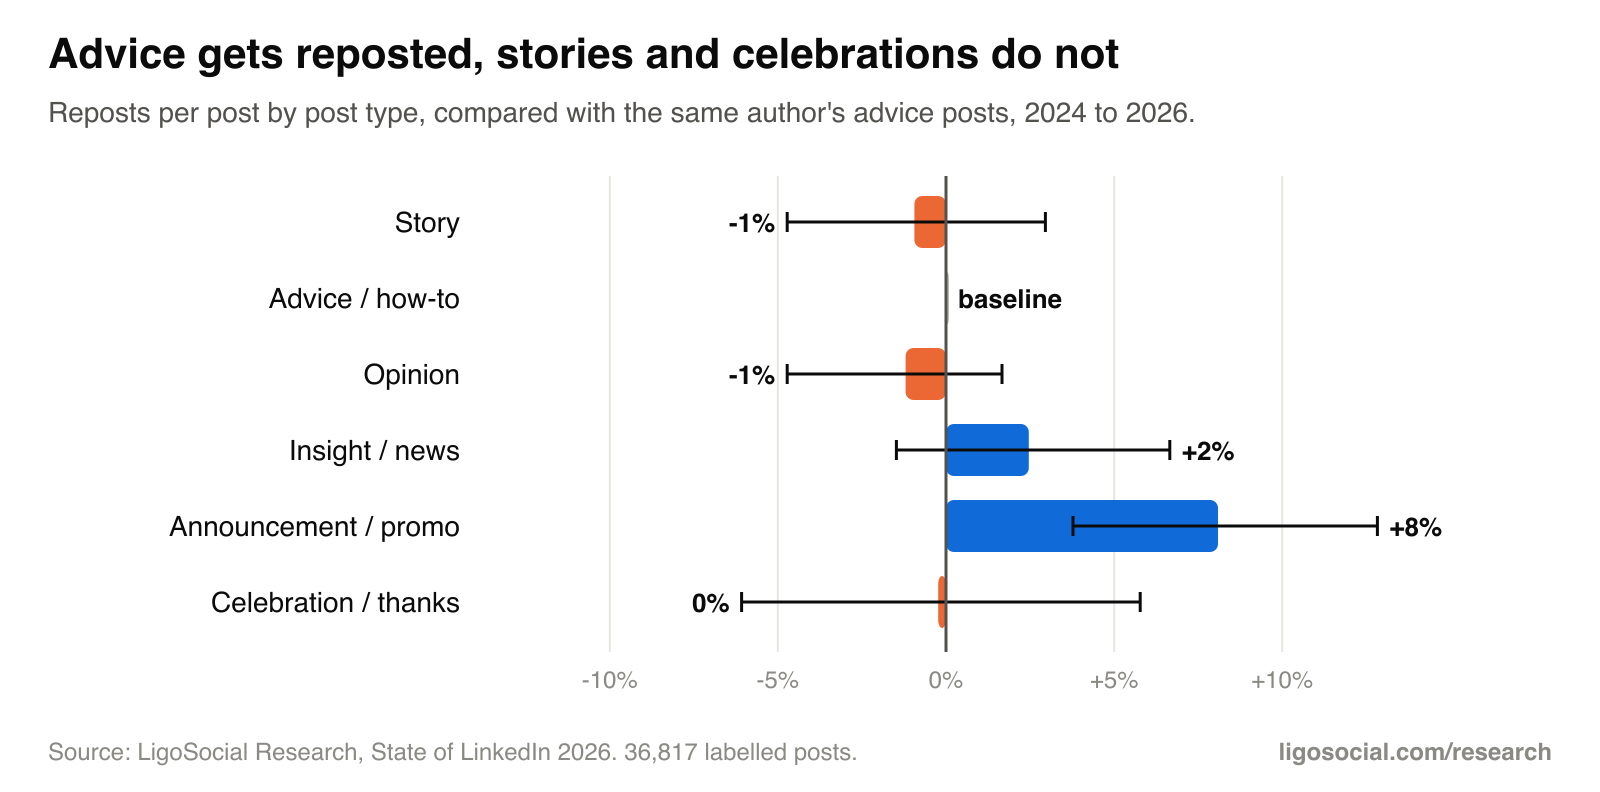
Against the same author's advice posts, celebrations drew 72% more comments, stories +22% and announcements +12%; opinions were level (+4%). Reposts barely vary by post type, so relative to reactions advice is the most shared: 9.1 reposts per 100 reactions vs 2.0 for stories and 0.9 for celebrations.
15% to 27%
Finding 10
Opinion posts nearly doubled, without a payoff
Opinion posts went from 15% of posts in 2024 to 27% in 2026, while advice fell from 30% to 24%. Opinions earned +3% vs advice by the same authors, so the shift to hot takes has not bought extra engagement.
+37% vs -10%
Finding 11
The most-written topics are the least rewarded
Sales and marketing, specialist expertise and AI or tech make up 56% of posts, and each did worse than the author's average (-7%, -10%, -10%). Careers (+37%), entrepreneurship (+30%) and events or community (+28%) are written about far less and did far better.
+40%
Finding 12
First-hand experience earns more
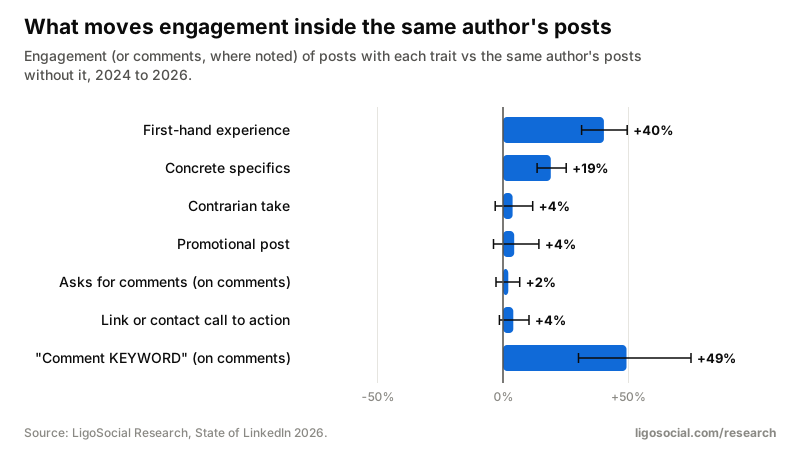
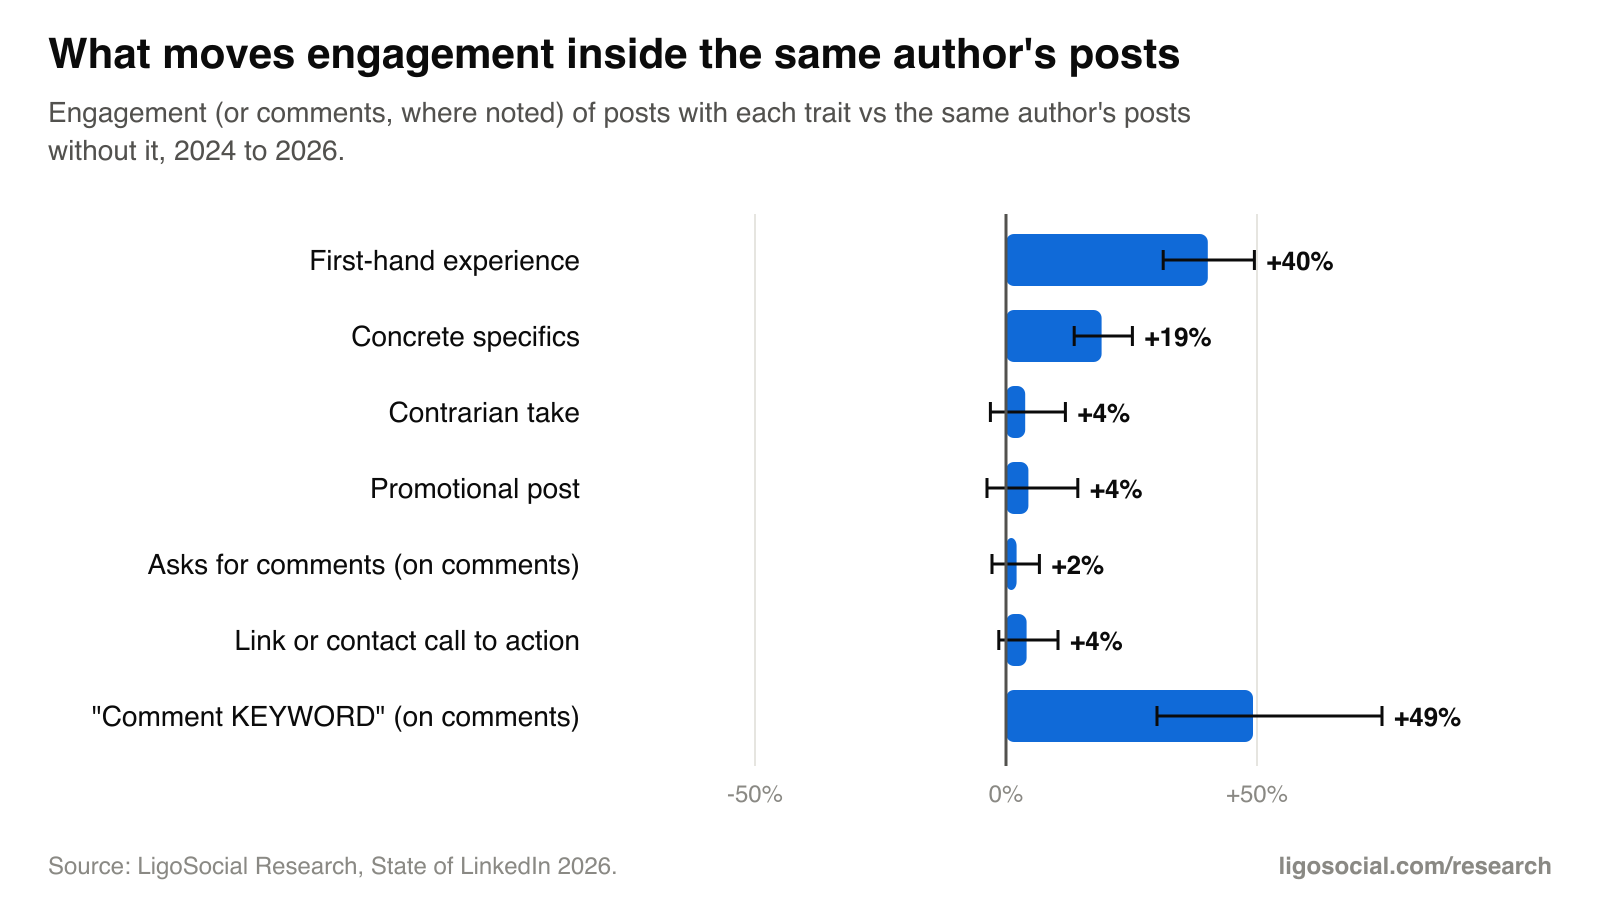
Posts where the author draws on something they did, saw or went through got 40% more engagement (95% CI +31% to +49%) and +31% comments vs the same author's posts without it.
+19%
Finding 13
Specific beats general
Posts with concrete specifics (real numbers, names, places, tools, dialogue) got +19% engagement vs the same author's general posts (95% CI +14% to +25%), and +16% comments.
+12% comments
Finding 14
Contrarian takes start conversations, not reach
Posts that take a debatable stance got +12% comments (95% CI +4% to +20%) but only +4% total engagement vs the same author's other posts. Only authors with 10,000+ followers saw a clear overall gain. Their share of posts tripled from 2% (2024) to 6% (2026).
+33%
Finding 15
Open with a moment, not a question
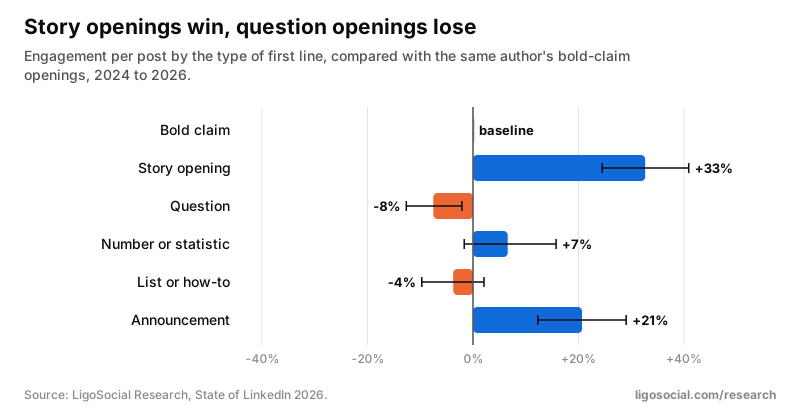
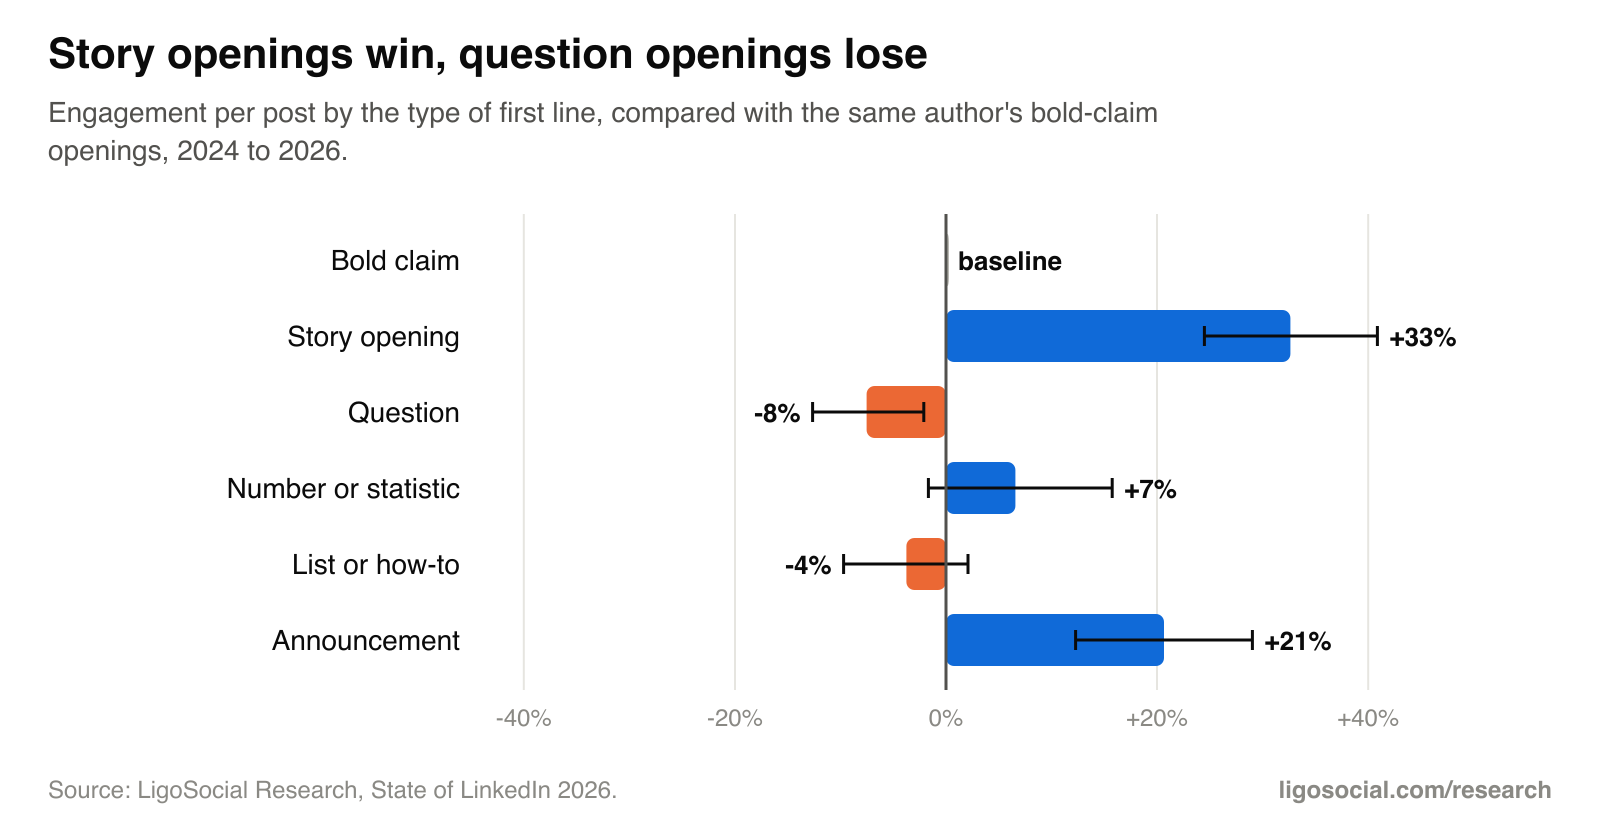
Posts whose first line opens a story got +33% engagement vs the same author's bold-claim openers (95% CI +24% to +41%). Question openers got -8%. Questions are the second most common opening (17% of posts); story openings are only 13%.
+2%
Finding 16
"What do you think?" does not add comments
Posts that end by asking readers to comment got +2% comments (95% CI -3% to +7%) and -10% total engagement vs the same author's posts that do not ask. 29% of posts do it anyway.
+49% comments
Finding 17
"Comment GUIDE and I will send it" works, for now
Posts asking readers to comment a keyword to receive something got +49% comments (95% CI +30% to +75%) and +22% total engagement vs the same author's other posts. The tactic went from 0.1% of posts in 2023 to 1.9% in 2026. Those comments are one word long and say little about whether the post was good.
+4%
Finding 18
Promotional posts are not penalised
Posts whose main purpose is to promote an offer, event or opening got +4% engagement vs the same author's other posts (95% CI -4% to +14%), and +13% reposts.
9% Celebrate
Finding 19
Each post type earns a different reaction
"Celebrate" makes up 9% of reactions on celebration posts vs 2% on advice. "Insightful" is highest on document posts (5.8%) and insight posts (3.7%). "Funny" is 8% of reactions on text-only posts and 9% on story posts, vs under 1% on image, video, link and document posts.
Formats
+36%
Finding 20
Images beat text-only posts
Posts with images got 36% more engagement than the same author's text-only posts (95% CI +30% to +42%). The gain holds in every follower band.
+26%
Finding 21
Documents only pay off past 10 pages, and they are the most reposted format
Document (carousel) posts got +22% vs text overall, but that comes from long ones: 11 to 15 pages +16% and 16+ pages +26% vs the author's average post, while 1 to 10 page documents sit at about -4%. Documents earn 8.4 reposts per 100 reactions, the most of any format (text-only: 1.5).
+27%
Finding 22
Long videos beat short clips
Videos over 5 minutes got +27% vs the author's average post; clips under 30 seconds got -7%.
-15%
Finding 23
The link penalty is the preview card, not the link
Link-preview posts got 15% less engagement than text-only posts by the same author (95% CI -19% to -10%). A URL typed into the body of an image or text post cost only 4% (95% CI -8% to +1%), though comments dipped 9%.
-50%
Finding 24
Polls lose half their engagement
Polls got -50% engagement vs the same author's text-only posts. Votes are not counted as reactions, so polls look worse than they feel, and they drew 24% less comments too.
Length, hashtags, emojis and tags
+24%
Finding 25
Longer posts win, up to the limit
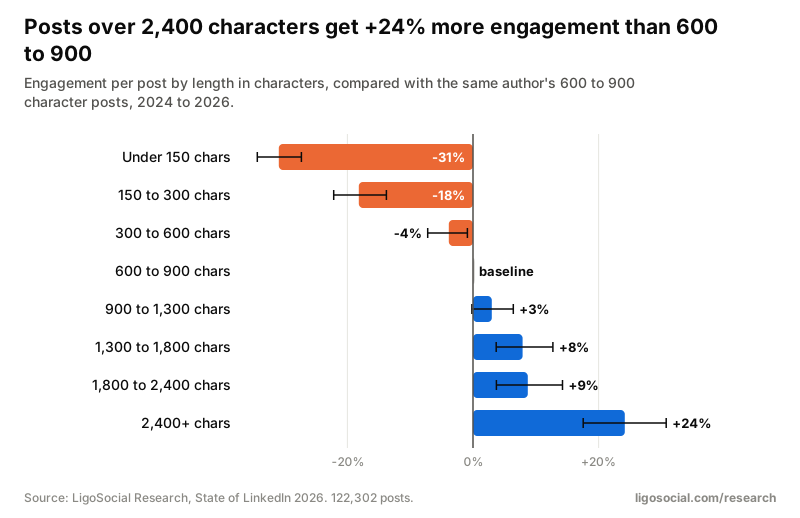
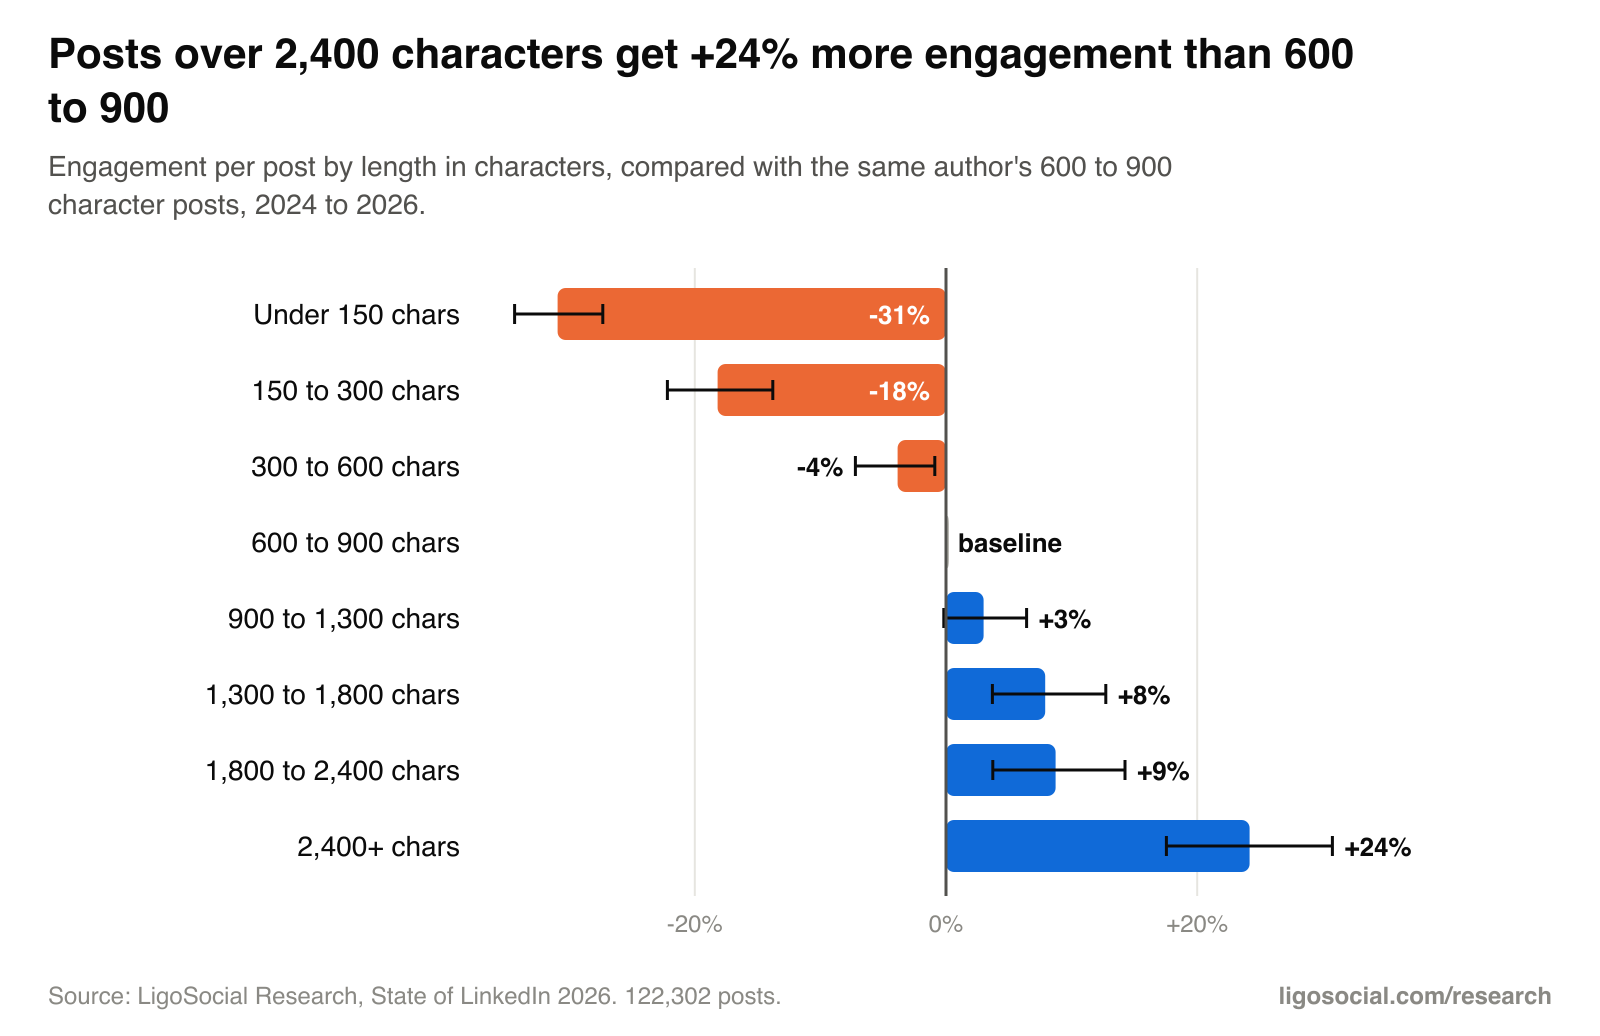
Posts over 2,400 characters got +24% engagement vs the same author's 600 to 900 character posts (95% CI +18% to +31%); posts under 150 characters got -31%. The curve climbs steadily with no sweet spot in the middle.
+13%
Finding 26
Hashtags and emojis are harmless, not magic
Posts with 6+ hashtags got +13% vs the same author's posts with none (95% CI +8% to +18%); 1 to 2 hashtags +3%. Emojis are similar: 1 to 3 emojis +11% vs none, and bold Unicode text made no difference (+1%). No penalty, no big reward. 54% of posts use none.
+35%
Finding 27
Tagging the people involved lifts engagement sharply
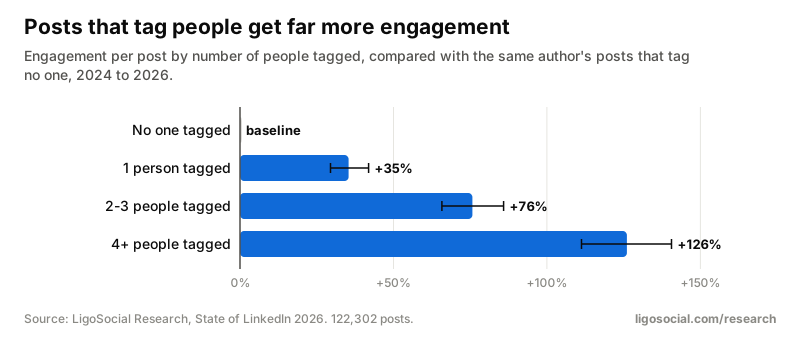
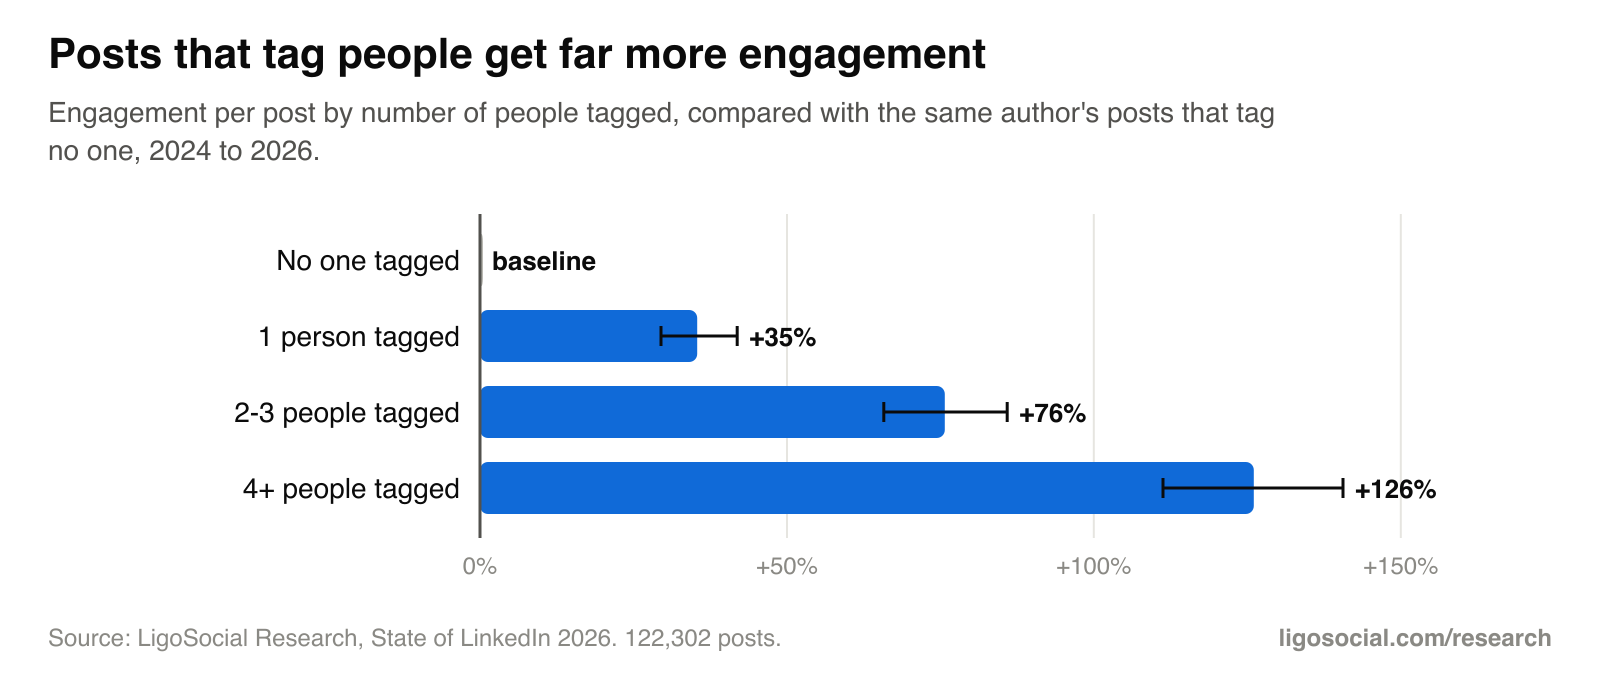
Tagging one person went with +35% engagement, 2 to 3 people +76%, and 4+ people +126%, against the same author's untagged posts. Tagged posts are often wins, events and collaborations, and the people tagged tend to engage, so treat this as "involve real people", not "tag strangers".
Timing and cadence
+9%
Finding 28
Sunday is the best day, and the hour barely matters
Sunday posts got +9% vs the author's average (95% CI +5% to +13%), yet only 7% of posts go out on Sundays. Every daytime slot from 6am to 10pm (local time) sits between -2% and +4%.
-10%
Finding 29
Posting twice in 24 hours costs the second post
Posts made within 24 hours of the author's previous post got -10% vs posts made 2 to 4 days after the last one (95% CI -13% to -7%).
-31%
Finding 30
More posts per week means less per post, but more in total
In weeks with 2 posts, each post got -9% vs single-post weeks; 3 to 4 posts -16%; 5 to 7 posts -23%. Even at 5 to 7 posts a week, total weekly engagement is several times a single post.
+26%
Finding 31
Comeback posts get a bump
The first post after a break of 30+ days got +26% vs a normal 2 to 4 day gap (95% CI +20% to +32%). Some of that is what people post when they return (new jobs, big news).
75% vs 55%
Finding 32
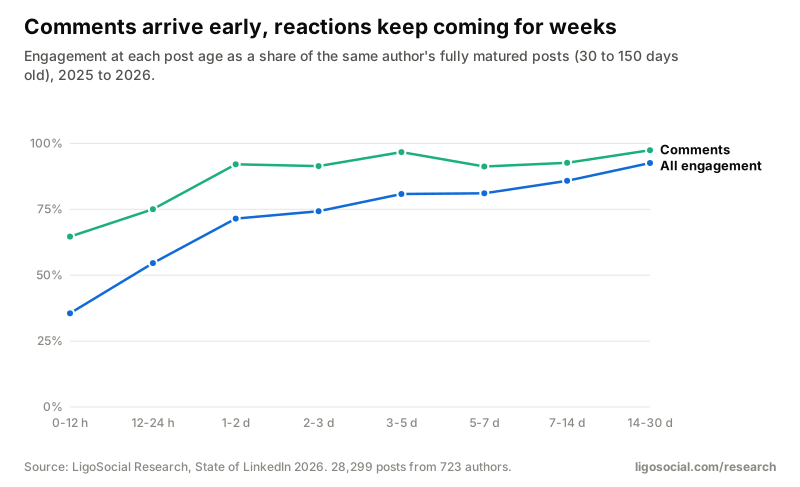
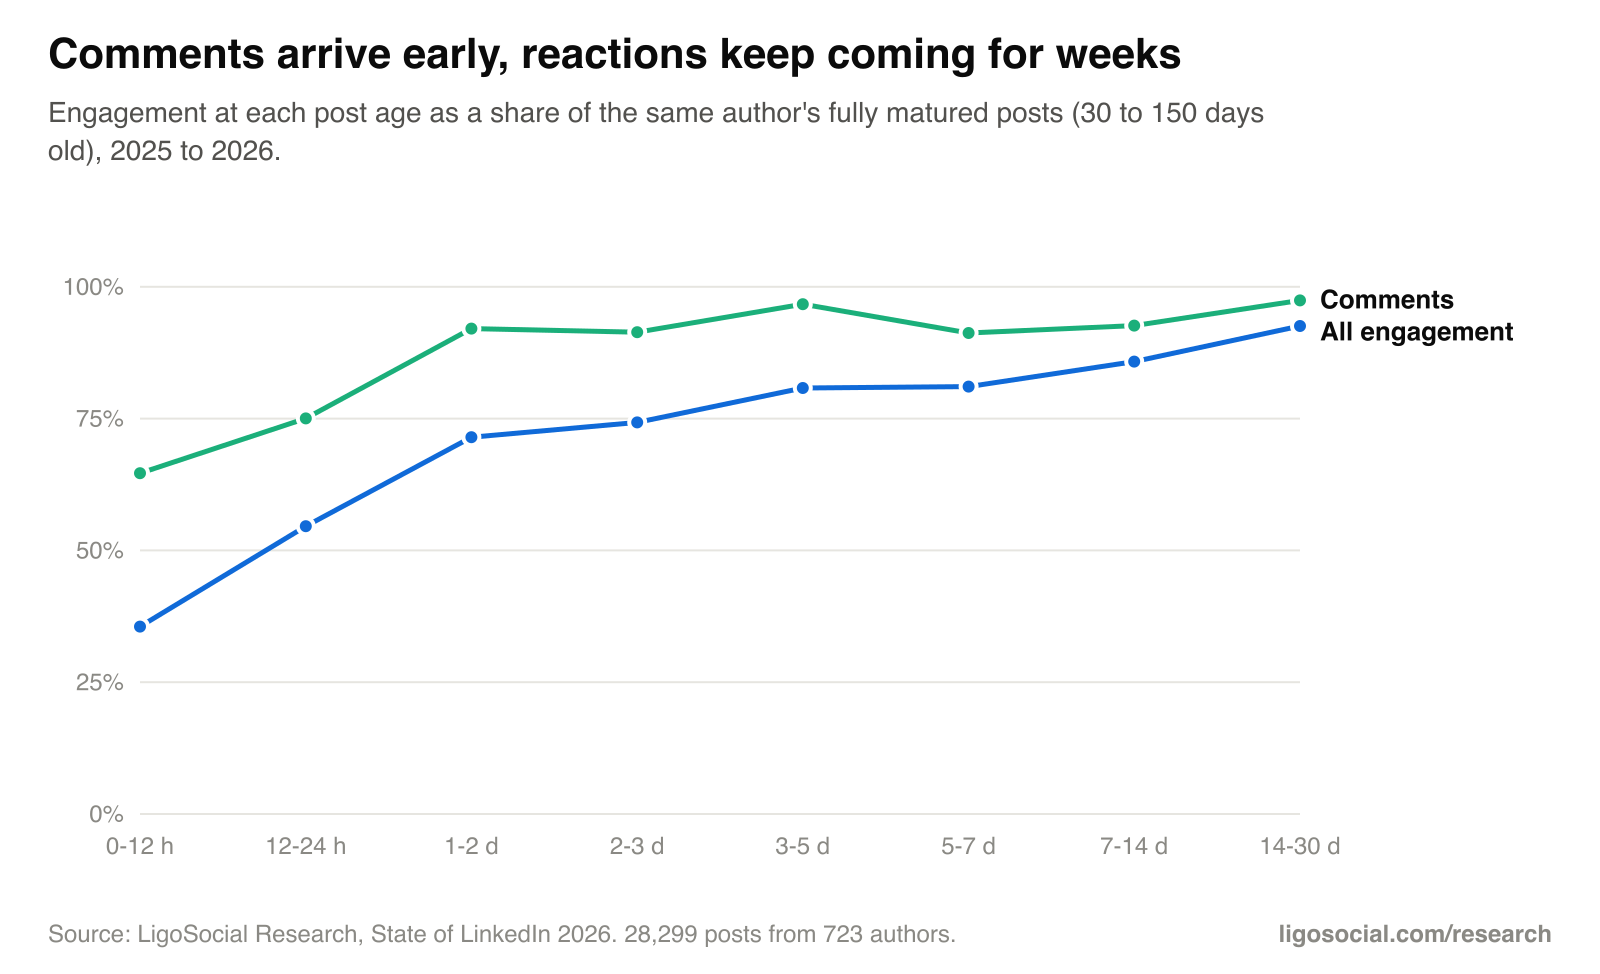
Comments come early, reactions keep coming
At 12 to 24 hours old, posts had 75% of the comments but only 55% of the total engagement of the same author's fully matured posts. Total engagement was still at 86% after one to two weeks.
Trends and benchmarks
+6%
Finding 33
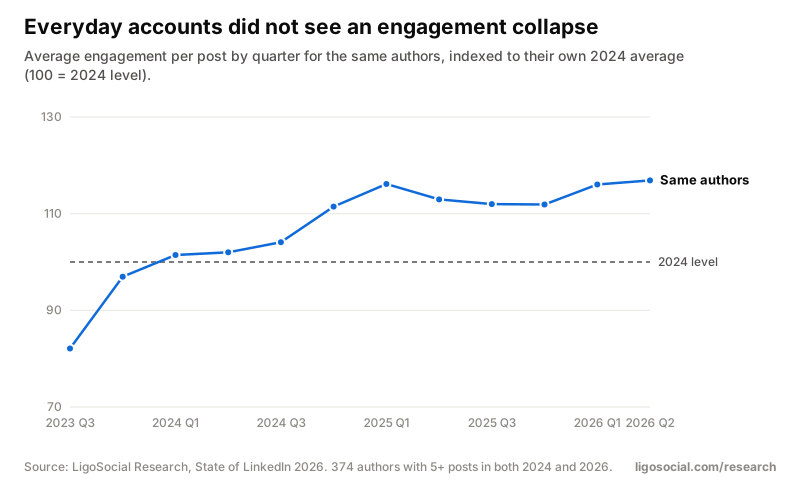
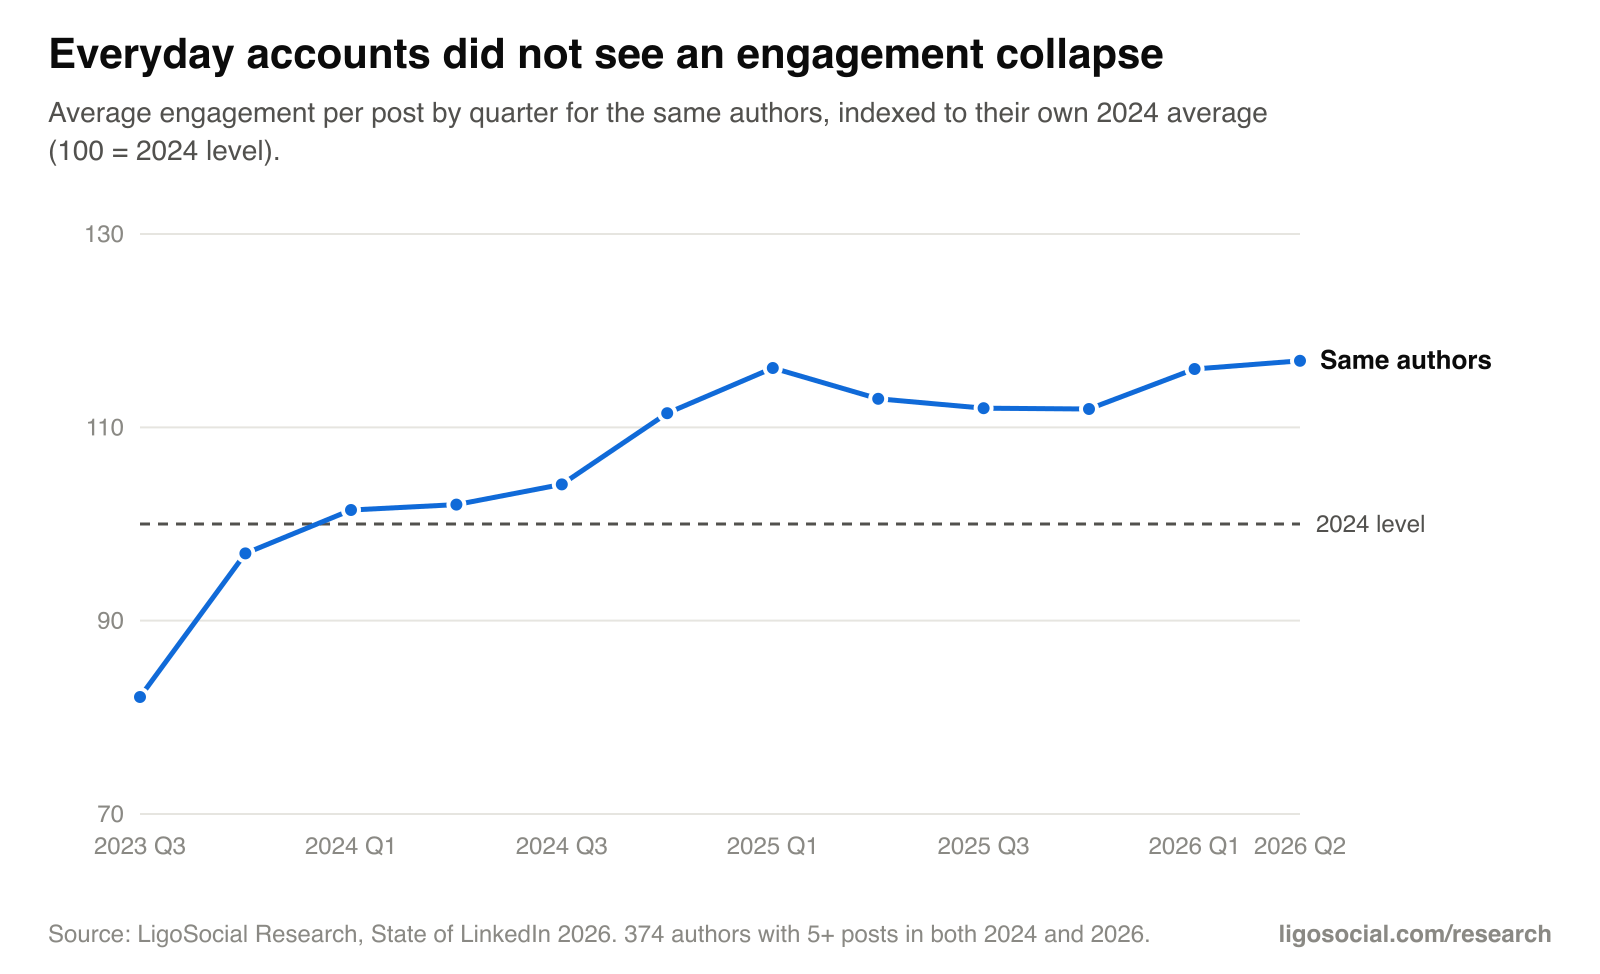
Everyday accounts did not see an engagement collapse
The same 372 people got +6% engagement per post in 2025 vs 2024 (95% CI 0% to +14%) and +7% in 2026 so far (CI -2% to +16%). Comments rose +13%. Headlines about engagement falling 25% or more describe big creators and views, not everyday professionals.
11% to 20%
Finding 34
Comments doubled their share of engagement
Comments were 11% of all engagement in 2024, 18% in 2025 and 20% in 2026.
10
Finding 35
The typical post earns less than you think
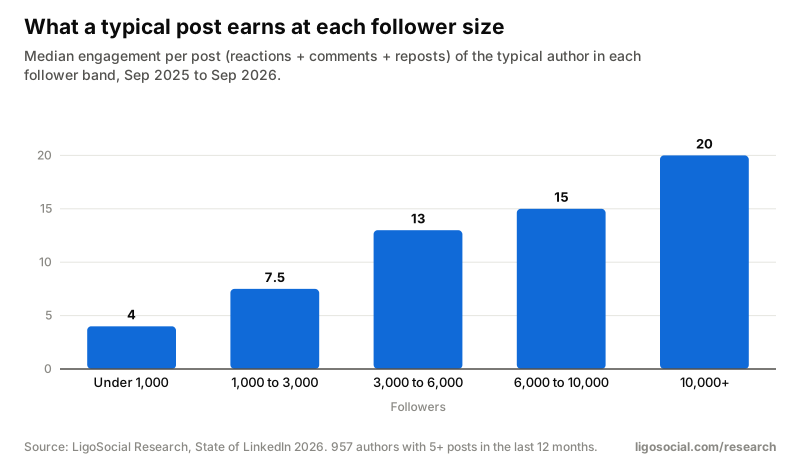
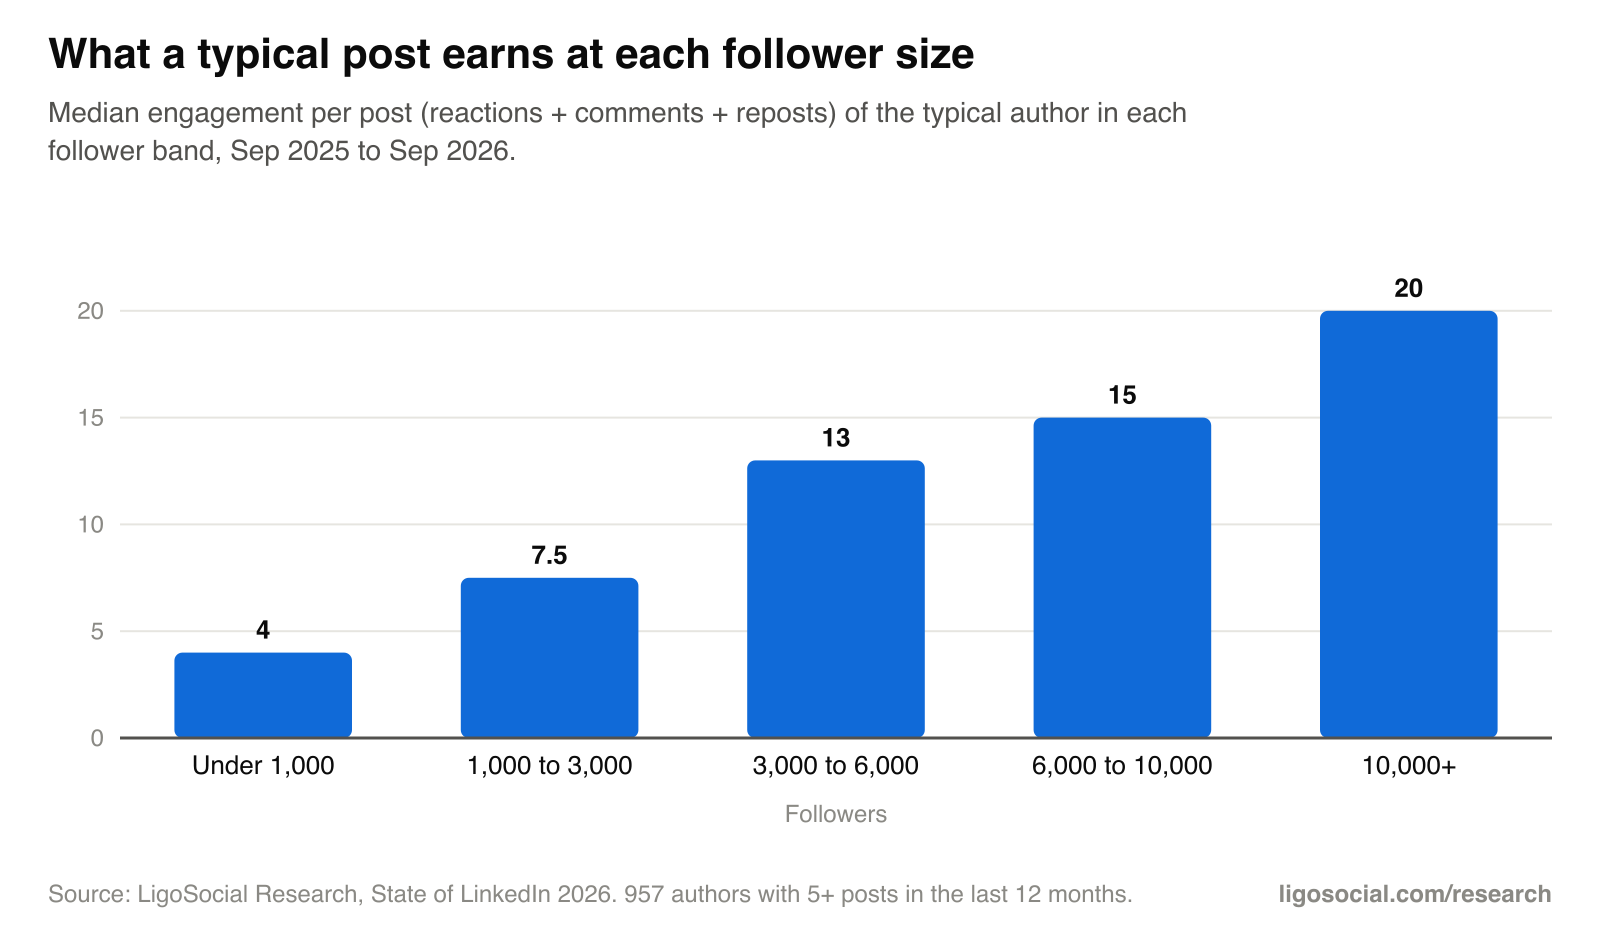
The typical author's median post got 10 reactions, comments and reposts combined in the last 12 months, and 1 comment. By band: Under 1,000 followers 4, 1,000 to 3,000 followers 7.5, 3,000 to 6,000 followers 13, 6,000 to 10,000 followers 15, 10,000+ followers 20. Engagement rate (per follower) falls from 0.96% under 1,000 followers to 0.12% at 10,000+.
Follower growth
1.2% to 2.1%
Finding 36
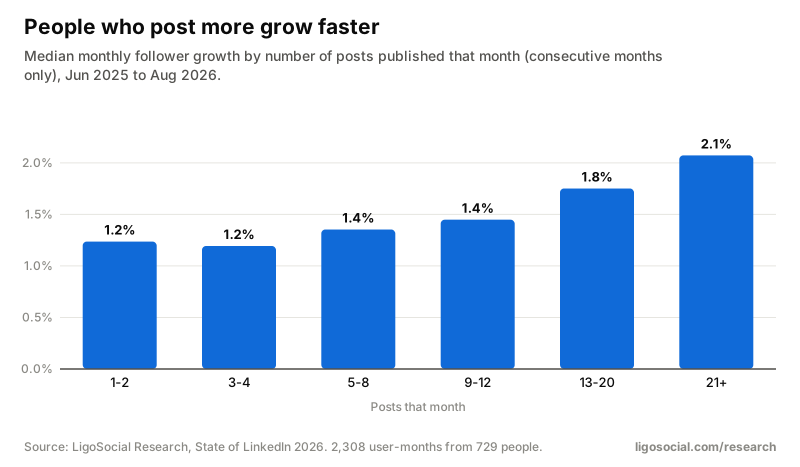
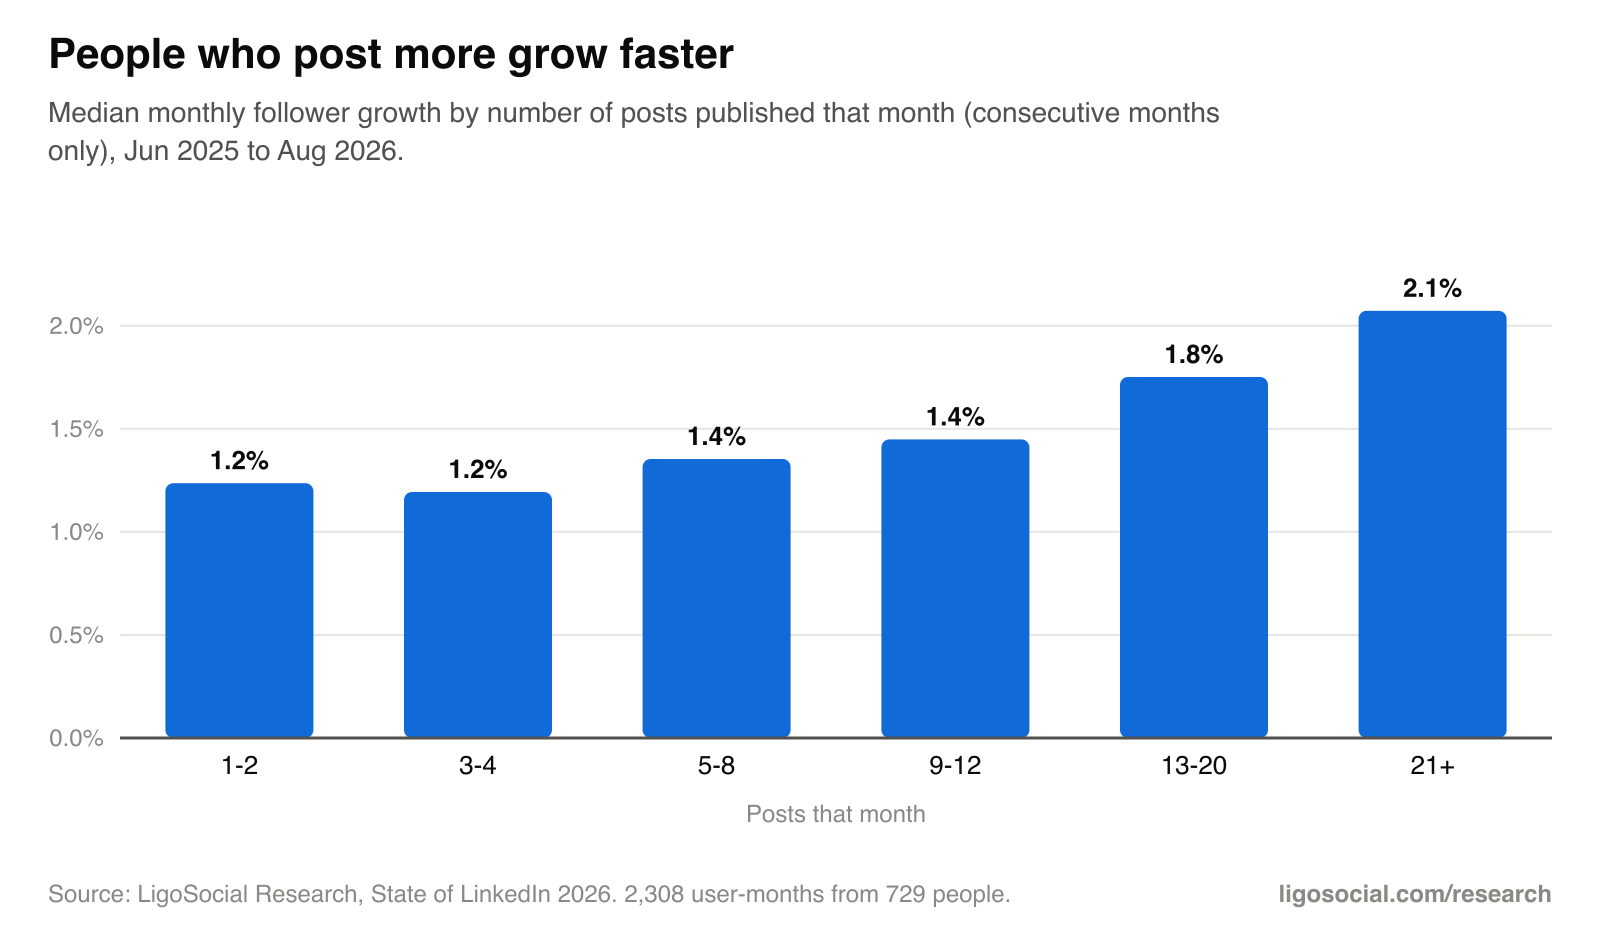
People who post more often grow faster
Median monthly follower growth was 1.2% in months with 1 to 2 posts and 2.1% in months with 21+. Within the same person, a month with twice the posts added only about 0.4 percentage points of growth (95% CI roughly 0 to 0.7), so habits built over months matter more than a busy week.
2.7% vs 1.0%
Finding 37
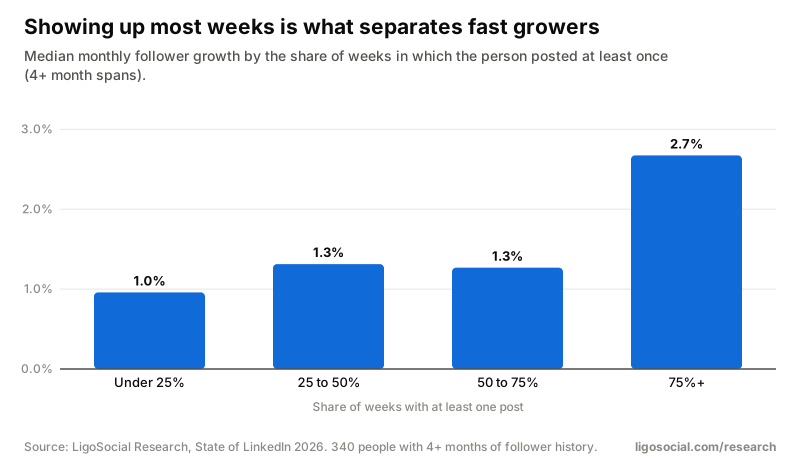
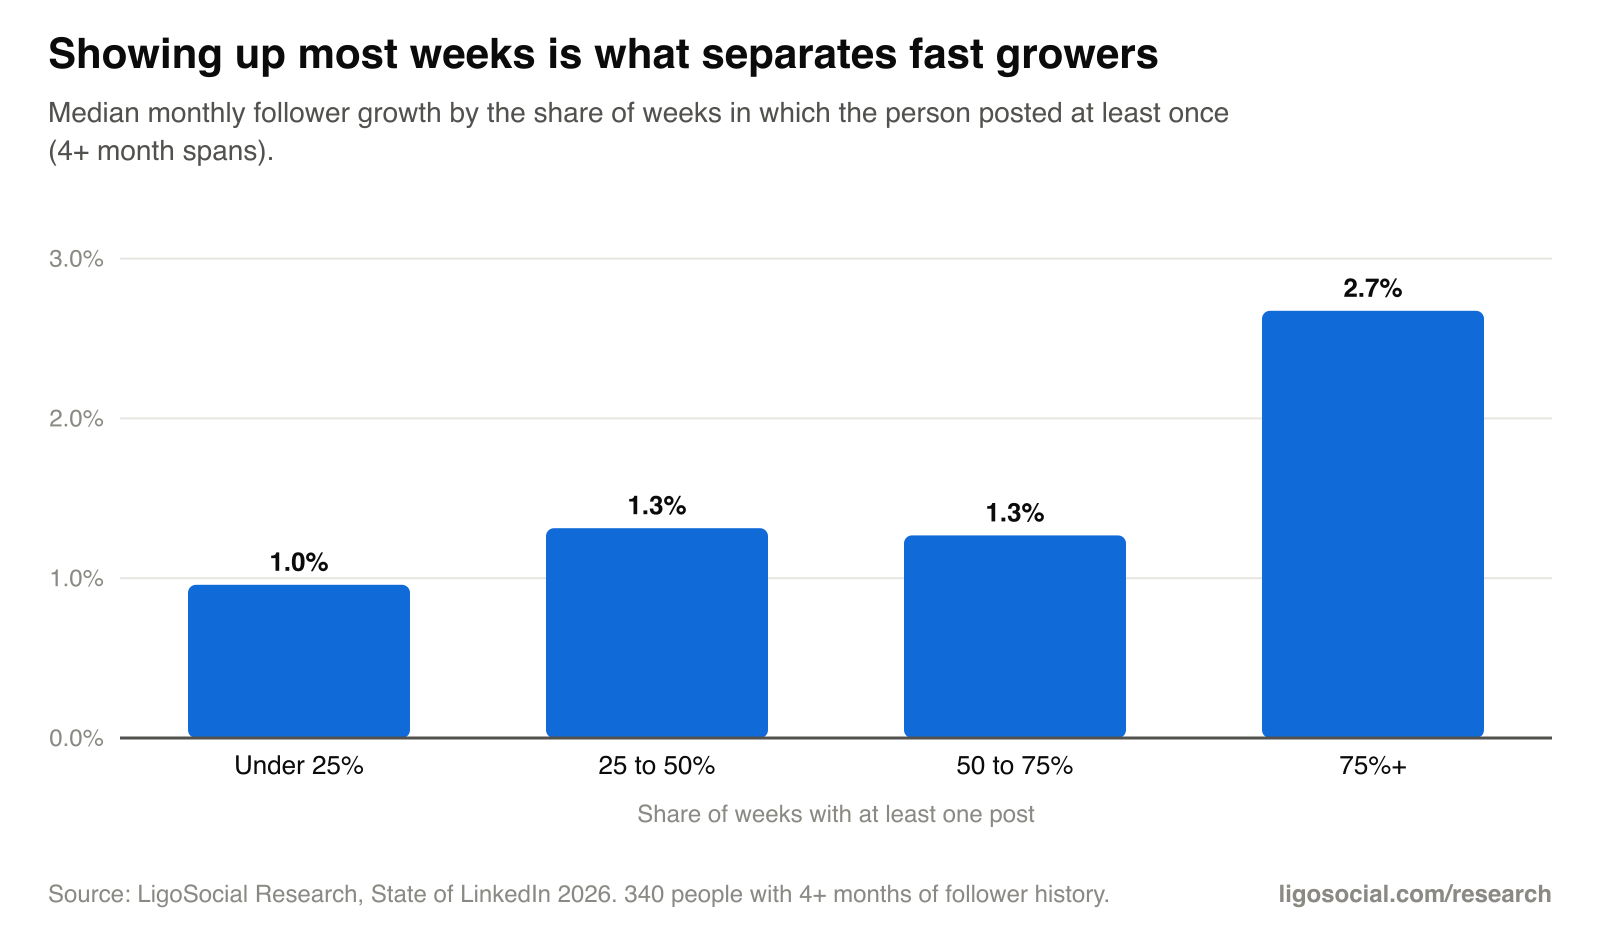
Consistency is the strongest growth signal
People who posted in at least 75% of weeks grew 2.7% a month (median) vs 1.0% for those who posted in fewer than 25% of weeks.
7.6 vs 3.2 posts/month
Finding 38
What the fastest growers did differently
The fastest-growing 20% (within their follower band) posted 7.6 times a month vs 3.2, in 69% of weeks vs 39%, with a longest weekly streak of 13 weeks vs 6. They used more images (61% of posts vs 47%), fewer link posts (2% vs 5%) and posted more on weekends (13% vs 8%). Post length was the same.
3.5%/month
Finding 39
Small accounts grow fastest in percentage terms
Median monthly follower growth: Under 1,000 3.5%, 1,000 to 3,000 1.9%, 3,000 to 6,000 2.0%, 6,000 to 10,000 1.1%, 10,000+ 0.7%.
Industries and regions
+18% / -53%
Finding 40
Industry and region shift the baseline
Compared with authors of the same follower count, education and training authors got +18% engagement, consulting +8%, software and IT +10%, marketing -7% and recruiting and HR -53% (recruiters often have large networks built for sourcing, not reading). By region, continental Europe got +18%, India +2%, North America -5%, the UK and Ireland -6% and the Gulf -18%.
What works at each follower count
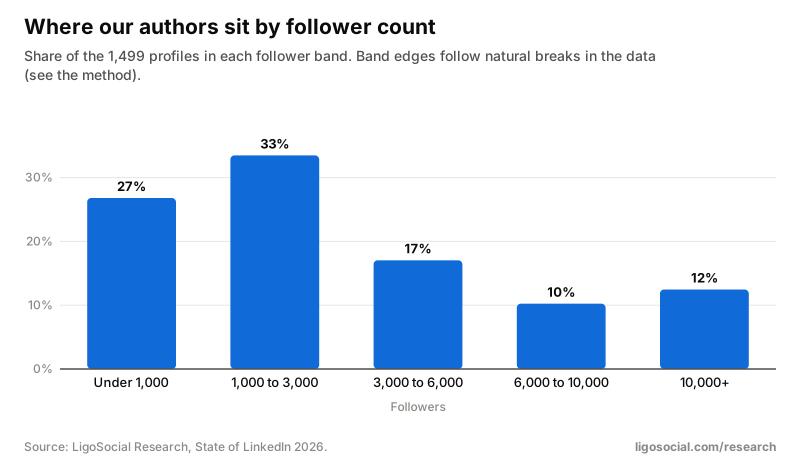
We did not pick follower bands in advance. We plotted the 1,499 profiles on a log scale and looked for natural breaks. Three features stand out: a jump in the number of profiles at 1,000 followers, a dip around 3,000, a second cluster from roughly 4,000 to 6,000 that thins out after 6,000, and a long tail beyond 10,000. A natural-breaks (Jenks) split of the same data lands at about 760, 2,900 and 11,000 for four groups, and 1,350, 3,550 and 10,400 for six. We used 1,000, 3,000, 6,000 and 10,000 so each band has 140+ authors and the edges are easy to remember.
Two more things change across the bands: the median post gets its first comment somewhere between 2,000 and 3,000 followers, and engagement per follower keeps falling as audiences grow. Below, each band gets its own micro-study: what worked, what did not, and what we would do in that position.
Under 1,000 followers
The starting band, about a quarter of our profiles. A typical post here gets 4 engagements and no comments, but the percentage upside is the largest in the study: followers grew a median 3.5% a month. At this size, a single tagged colleague or a good photo moves the numbers more than any algorithm trick.
Follower band under-1000
Under 1,000 followers
398 authors, 11,234 posts
What worked
- Tagging at least one person: +98% (71 authors)
- Image posts vs text-only: +31% (137 authors)
- First post after a 30+ day break: +20% (174 authors)
- Posts of 1,300+ characters vs shorter: +16% (165 authors)
What did not
- Posts under 300 characters vs longer: -24% (140 authors)
- Posts that read as AI (same author, same year): -14% (113 authors)
- Posting within 24 hours of your last post: -12% (154 authors)
Do this
- Post every week, then build to 2 a week. Months with 5 to 8 posts saw median follower growth of 4.4% vs 2.1% in months with 1 or 2.
- Write fuller posts. 1,300+ characters got +16% and posts under 300 characters -24% for the same people.
- Add a real photo or visual: image posts got +31% vs text-only.
- Bring the people involved into the post. Tagging at least one person went with +98% (often a colleague, client or event host who then engages).
- Do not post twice in one day (-12% for the second post), and write in your own voice: AI-sounding posts got -14%.
- Judge posts by reactions and conversations started in DMs, not comments: the median post at this size gets none.
| Measure | Typical author | Top 25% of authors |
|---|---|---|
| Engagement per post | 4 | 10 |
| Comments per post | 0 | 0.5 |
| Engagement rate (per follower) | 0.96% | 2.17% |
| Monthly follower growth | 3.5% | 9.9% |
| Posts in the last 12 months | 12 |
173 authors with 5+ posts for engagement; 130 people for growth. Effects above compare posts by the same author, 2024 to 2026.
1,000 to 3,000 followers
The biggest band and the peak of our distribution: the count of profiles jumps as people pass 1,000 followers. A typical post gets 7.5 engagements, and the median post still gets no comments. Monthly growth was 1.9%. This is where content choices start to matter a lot: the gap between story and advice posts is widest here.
Follower band 1000-3000
1,000 to 3,000 followers
497 authors, 26,328 posts
What worked
- Celebration and thank-you posts vs other posts: +111% (63 authors)
- First-hand experience vs not: +56% (91 authors)
- Tagging at least one person: +55% (219 authors)
- Story posts vs other posts: +33% (84 authors)
- Image posts vs text-only: +31% (257 authors)
What did not
- Polls vs text-only: -52% (38 authors)
- Posts under 300 characters vs longer: -24% (272 authors)
- Posts that read as AI (same author, same year): -23% (278 authors)
- Advice posts vs other posts: -17% (88 authors)
Do this
- Share your wins and thank people by name. Celebration and thank-you posts got +111% and first-hand posts +56% against the same people's other posts.
- Turn advice into a story. Advice posts got -17% vs these authors' other posts, while stories got +33%. Show the moment you applied the advice.
- Use images (+31%) and documents (+24%) over link previews (-16%) and polls (-52%).
- Go longer: 1,300+ characters got +15%. A handful of relevant hashtags does not hurt here (6+ hashtags +14%).
- Aim for 3 to 5 posts a week if you want growth. Months with 13 to 20 posts grew 3.7% vs 1.4% with 1 or 2, and never post twice in 24 hours (-13%).
- Keep your own voice: AI-sounding posts got -23% in this band.
| Measure | Typical author | Top 25% of authors |
|---|---|---|
| Engagement per post | 7.5 | 15.5 |
| Comments per post | 0 | 1.5 |
| Engagement rate (per follower) | 0.43% | 0.98% |
| Monthly follower growth | 1.9% | 5.0% |
| Posts in the last 12 months | 22 |
304 authors with 5+ posts for engagement; 254 people for growth. Effects above compare posts by the same author, 2024 to 2026.
3,000 to 6,000 followers
A second cluster sits here, after a dip in profile counts around 3,000. A typical post gets 13 engagements and the median post finally earns a comment. Monthly growth was 2.0%. This is the band where concrete specifics pay the most.
Follower band 3000-6000
3,000 to 6,000 followers
253 authors, 29,152 posts
What worked
- Celebration and thank-you posts vs other posts: +121% (40 authors)
- Tagging at least one person: +72% (180 authors)
- First-hand experience vs not: +45% (49 authors)
- Image posts vs text-only: +44% (175 authors)
- First post after a 30+ day break: +43% (195 authors)
What did not
- Polls vs text-only: -48% (51 authors)
- Posts under 300 characters vs longer: -29% (188 authors)
- Posts that read as AI (same author, same year): -23% (190 authors)
- Advice posts vs other posts: -17% (50 authors)
Do this
- Be specific. Posts with real numbers, names, tools or examples got +37%, the largest specificity gain of any band.
- Back opinions with a story. Opinion posts got -16% and advice -17%, while stories got +35% and first-hand posts +45%.
- Write long: 1,300+ characters got +26%, posts under 300 characters -29%.
- Lead with a visual: images +44%, video +20%, documents +19% vs text-only.
- Stop ending every post with a question (-7%) and avoid same-day double posts (-15%).
- Volume still pays for growth: 21+ posts a month grew 3.0% vs 1.3% at 1 or 2.
| Measure | Typical author | Top 25% of authors |
|---|---|---|
| Engagement per post | 13 | 28 |
| Comments per post | 1 | 3 |
| Engagement rate (per follower) | 0.31% | 0.64% |
| Monthly follower growth | 2.0% | 3.5% |
| Posts in the last 12 months | 32.5 |
194 authors with 5+ posts for engagement; 168 people for growth. Effects above compare posts by the same author, 2024 to 2026.
6,000 to 10,000 followers
Profiles thin out past 6,000 followers. A typical post gets 15 engagements and growth slows to 1.1% a month. Your audience is now large enough that what you announce matters to people, and link previews hurt more here than anywhere else.
Follower band 6000-10000
6,000 to 10,000 followers
152 authors, 23,409 posts
What worked
- Celebration and thank-you posts vs other posts: +76% (32 authors)
- Tagging at least one person: +56% (114 authors)
- Image posts vs text-only: +42% (116 authors)
- First-hand experience vs not: +38% (41 authors)
- First post after a 30+ day break: +31% (115 authors)
What did not
- Polls vs text-only: -54% (42 authors)
- Posts under 300 characters vs longer: -26% (126 authors)
- Link-preview posts vs text-only: -25% (99 authors)
- Posts that read as AI (same author, same year): -21% (147 authors)
Do this
- Drop link-preview posts. They cost -25% here, the worst of any band. Use a document (+28%) or an image (+42%) and point to the link another way.
- Announce things. Announcements got +14% vs these authors' other posts: at this size people care about your launches, hires and events.
- Tell first-hand stories (+38%) instead of generic advice (-16%).
- Tag the people you work with (+56%) and celebrate them (+76%).
- Keep posts long (+17% at 1,300+ characters) and never under 300 (-26%).
- Write it yourself: AI-sounding posts got -21%.
| Measure | Typical author | Top 25% of authors |
|---|---|---|
| Engagement per post | 15 | 33 |
| Comments per post | 1 | 3.5 |
| Engagement rate (per follower) | 0.18% | 0.42% |
| Monthly follower growth | 1.1% | 2.3% |
| Posts in the last 12 months | 46 |
121 authors with 5+ posts for engagement; 106 people for growth. Effects above compare posts by the same author, 2024 to 2026.
10,000+ followers
The long tail: established voices and a few true creators. A typical post gets 20 engagements and 2 comments, but engagement per follower is the lowest of any band (0.12%) and growth is 0.7% a month. This is the only band where contrarian takes clearly pay, and where posting more stops buying extra follower growth.
Follower band 10000-plus
10,000+ followers
185 authors, 43,648 posts
What worked
- Celebration and thank-you posts vs other posts: +88% (43 authors)
- Tagging at least one person: +46% (149 authors)
- First-hand experience vs not: +40% (58 authors)
- Image posts vs text-only: +34% (158 authors)
- Story posts vs other posts: +32% (57 authors)
What did not
- Polls vs text-only: -51% (58 authors)
- Posts under 300 characters vs longer: -34% (162 authors)
- Posts that read as AI (same author, same year): -22% (207 authors)
- Link-preview posts vs text-only: -16% (133 authors)
Do this
- Take a position. Contrarian takes got +17% here, the only band where they clearly paid.
- Quality over volume for growth. Follower growth barely changed with posting frequency (0.8% a month at 1 or 2 posts vs 0.9% at 21+), so spend the time on fewer, better posts.
- Be concrete and personal: specifics +29%, first-hand posts +40%, stories +32%.
- Skip short posts (-34% under 300 characters, the biggest short-post penalty of any band) and do not end on a question (-13%).
- Space your posts: a second post within 24 hours got -16%.
- Guard your voice: AI-sounding posts got -22%, even with a large audience.
| Measure | Typical author | Top 25% of authors |
|---|---|---|
| Engagement per post | 20 | 48.5 |
| Comments per post | 2 | 6 |
| Engagement rate (per follower) | 0.12% | 0.28% |
| Monthly follower growth | 0.7% | 1.5% |
| Posts in the last 12 months | 60 |
165 authors with 5+ posts for engagement; 134 people for growth. Effects above compare posts by the same author, 2024 to 2026.
What this data cannot tell you
- Views, saves and dwell time. We only see reactions, comments and reposts, so "engagement" here means those three. Formats like polls and documents may win on views while losing on engagement.
- Causation. These are observational comparisons. Comparing posts by the same author removes a lot of noise (audience size, niche, network), but people choose what to post, and a great week can drive both the format and the result.
- All of LinkedIn. Our authors chose to use an AI writing assistant, so they are more active and more AI-curious than the average member. Trends and within-author effects travel better than absolute levels.
- Follower history. Follower counts are current, and monthly follower snapshots only start in June 2025, so growth findings cover about 15 months.
- Judged labels. Post types, openings and "reads as AI" come from a calibrated AI judge, not human coders. It is accurate, not perfect: see the calibration table in the methodology.
Post what the data says works, in your own voice
LigoSocial learns how you write from your own LinkedIn posts, then drafts posts, comments and replies in that voice right inside LinkedIn. You approve what goes out.
Add LigoSocial to ChromeOr try it at ligosocial.comCommon questions
- How many posts and profiles are in the study?
- 134,522 posts from 1,499 LinkedIn profiles, January 2023 to September 2026, after removing company pages, duplicates, posts under 7 days old and accounts that were deleted. The raw pool was 179,927 posts.
- Do AI-written LinkedIn posts get less engagement?
- In our data, yes. Posts that read as AI got 22% less engagement than the same author's other posts in the same year. See the AI study.
- What is the best day to post on LinkedIn?
- Sunday, by a modest margin: +9% vs the author's average. The hour of day barely matters. See best day to post.
- What is a good engagement rate on LinkedIn?
- For the typical author in our data, engagement per post divided by followers is 0.32% (median) and 0.83% for the top quarter. It falls as follower counts grow. See benchmarks.
- Can I use these numbers?
- Yes. The report, charts and CSV files are free to use under CC BY 4.0. Please credit "LigoSocial Research" and link to this page.
Download the data
- CSV
All 40 findings with numbers and sample sizes
One row per finding.
40 rows, CSV
- CSV
Post format effects by follower band
Engagement vs the same author's text-only posts, 2024 to 2026.
41 rows, CSV
- CSV
Post length effects by follower band
Engagement vs the same author's 600 to 900 character posts.
48 rows, CSV
- CSV
Day, hour, region and posting gaps
Engagement vs the same author's average post (local time).
94 rows, CSV
- CSV
Engagement benchmarks by follower band
Typical author in each band, September 2025 to September 2026.
5 rows, CSV
- CSV
Follower growth by posting frequency and consistency
Median monthly follower growth, June 2025 to August 2026.
41 rows, CSV
- CSV
Post types, openings, topics, traits and the AI penalty
Labelled with a calibrated judge; within-author comparisons.
79 rows, CSV
- CSV
Share of posts that read as AI, by half-year
Posts of 300+ characters, calibrated judge, with the pre-ChatGPT false-positive baseline.
9 rows, CSV
Suggested citation
LigoSocial Research (2026). The State of LinkedIn 2026: what works for everyday professionals. https://ligosocial.com/research/state-of-linkedin-2026
Free to reuse under CC BY 4.0: quote the numbers, embed the charts or rework the data, with credit to LigoSocial Research and a link to this page. Every figure is aggregated and anonymised; no individual, profile or post can be identified.
How we collect, clean and anonymise the data: methodology. Questions or a cut we have not published? Ask us.
Related research
- ReportDo AI-written LinkedIn posts get less engagement?AI-sounding posts get 22% less engagement, and the share of them peaked in 2024 to 2025.
- ReportEm dashes and AI: how often LinkedIn posts use themEm dash use rose sevenfold, then fell. The dash is a marker, not the problem.
- ReportLinkedIn post formats compared: images, carousels, video, text, links and pollsImages +36%, link previews -15%, polls -50%. Carousels only pay past 10 pages.
- ReportHow long should a LinkedIn post be? What 134k posts showLonger posts win: 2,400+ characters +24% vs 600 to 900.
- ReportDo hashtags work on LinkedIn? What 134k posts showHashtags: no penalty, small lift. Tagging people: +35% to +126%.