
Key findings
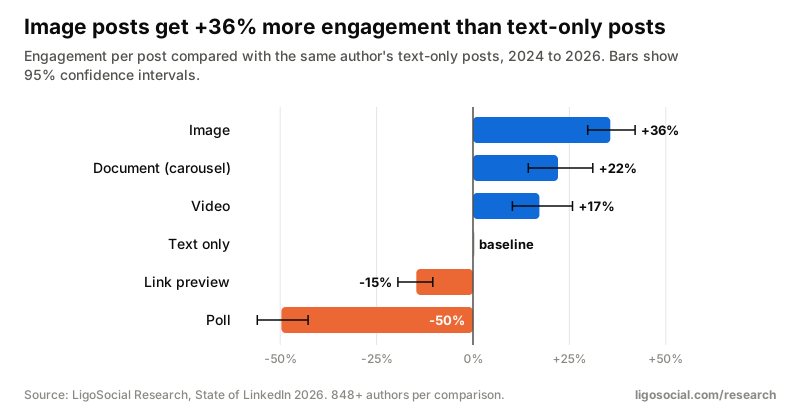
- Images +36%, documents +22%, video +17%, link previews -15%, polls -50% vs text-only.
- Carousels only pay past 10 pages; videos past 5 minutes.
- Documents are the most reposted format (8.4 reposts per 100 reactions).
- The link penalty comes from the preview card, not the URL.
Contents
The short answer
For everyday professionals, images beat text-only posts by 36%, documents and video come next (+22% and +17%), link-preview posts lose 15% and polls lose 50%. Every number compares posts by the same author, so a format is not credited just because big accounts happen to use it.
Formats by follower band
| Followers | Text only | Image | Document (carousel) | Video | Link preview | Poll |
|---|---|---|---|---|---|---|
| All authors | baseline | +36% | +22% | +17% | -15% | -50% |
| Under 1,000 | baseline | +31% | +14% | -1% | -4% | n/a |
| 1,000 to 3,000 | baseline | +31% | +24% | +18% | -16% | -52% |
| 3,000 to 6,000 | baseline | +44% | +19% | +20% | -13% | -48% |
| 6,000 to 10,000 | baseline | +42% | +28% | +20% | -25% | -54% |
| 10,000+ | baseline | +34% | +24% | +21% | -16% | -51% |
n/a: fewer than 20 authors or 100 posts in the cell. 2024 to 2026.
Images win in every band. Link previews hurt most at 6,000 to 10,000 followers. Under 1,000 followers most format differences are too small to call, apart from images.
Documents (carousels): length decides
+26%
Finding 21
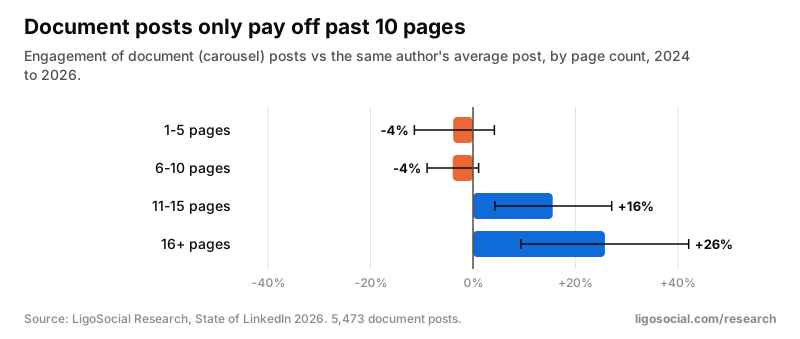
Documents only pay off past 10 pages, and they are the most reposted format
Document (carousel) posts got +22% vs text overall, but that comes from long ones: 11 to 15 pages +16% and 16+ pages +26% vs the author's average post, while 1 to 10 page documents sit at about -4%. Documents earn 8.4 reposts per 100 reactions, the most of any format (text-only: 1.5).
Video: longer is better
+27%
Finding 22
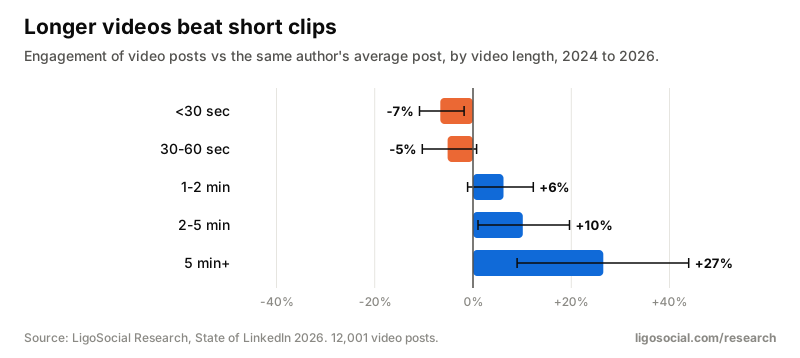
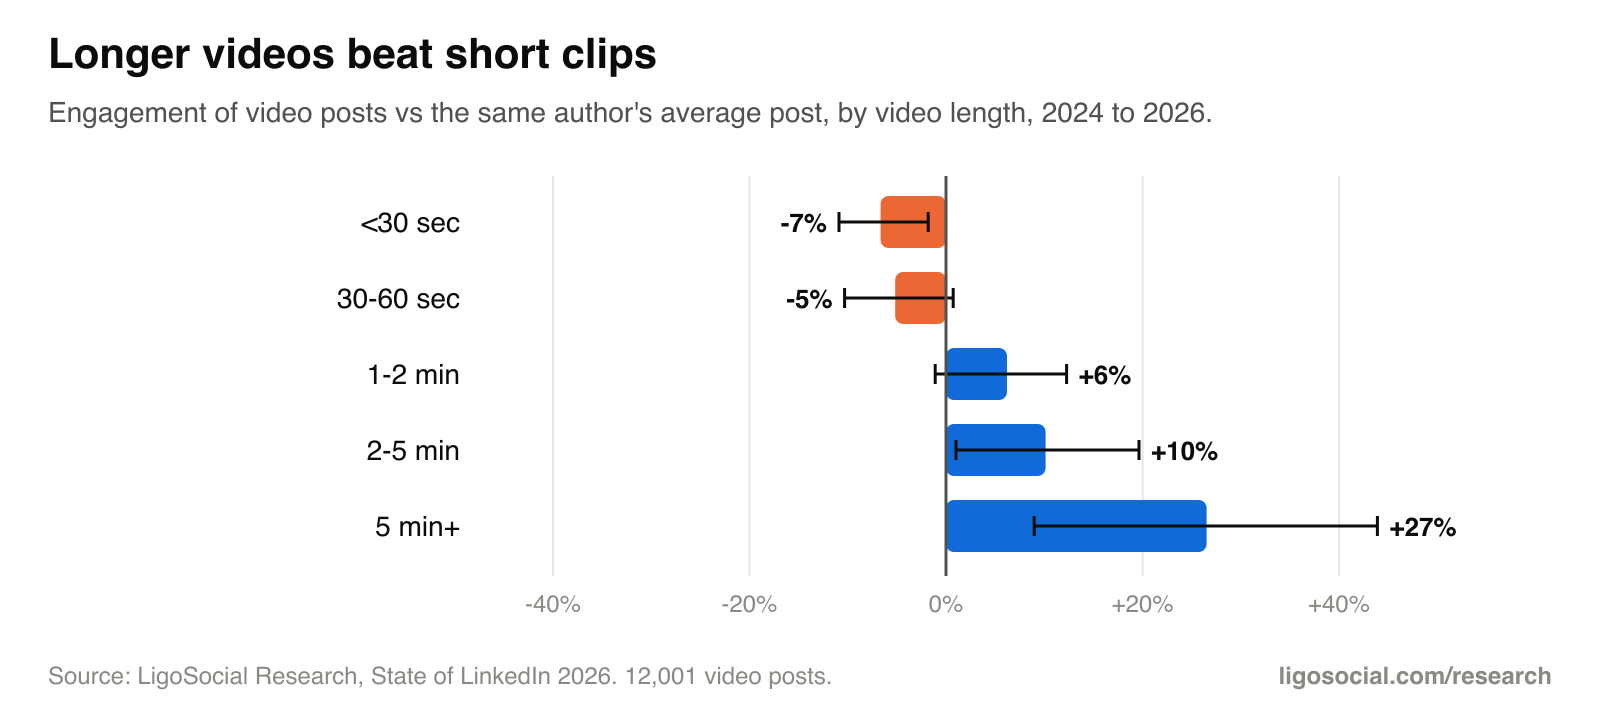
Long videos beat short clips
Videos over 5 minutes got +27% vs the author's average post; clips under 30 seconds got -7%.
Links: the card is the problem
-15%
Finding 23
The link penalty is the preview card, not the link
Link-preview posts got 15% less engagement than text-only posts by the same author (95% CI -19% to -10%). A URL typed into the body of an image or text post cost only 4% (95% CI -8% to +1%), though comments dipped 9%.
Polls
-50%
Finding 24
Polls lose half their engagement
Polls got -50% engagement vs the same author's text-only posts. Votes are not counted as reactions, so polls look worse than they feel, and they drew 24% less comments too.
What to do
Post what the data says works, in your own voice
LigoSocial learns how you write from your own LinkedIn posts, then drafts posts, comments and replies in that voice right inside LinkedIn. You approve what goes out.
Add LigoSocial to ChromeOr try it at ligosocial.comCommon questions
- Which LinkedIn post format gets the most engagement?
- In our data, image posts: +36% vs the same author's text-only posts. Long documents (11+ pages) and long videos (5+ minutes) also do well.
- Do LinkedIn carousels still work in 2026?
- Long ones do. Document posts of 11 to 15 pages got +16% and 16+ pages +26% vs the author's average post; 1 to 10 pages did not beat it.
- Does LinkedIn penalize external links?
- Link-preview posts got -15% vs text-only posts by the same author. A link typed in the body of an image or text post cost only 4%, so the preview card, not the link, is the problem.
Download the data
Suggested citation
LigoSocial Research (2026). LinkedIn post formats compared: images, carousels, video, text, links and polls. https://ligosocial.com/research/linkedin-post-formats
Free to reuse under CC BY 4.0: quote the numbers, embed the charts or rework the data, with credit to LigoSocial Research and a link to this page. Every figure is aggregated and anonymised; no individual, profile or post can be identified.
Does your next post read as AI?
Paste it into the free LinkedIn AI Detector. It scores the post and points at the phrases and patterns that give it away. Nothing you paste is stored.
How we collect, clean and anonymise the data: methodology. Questions or a cut we have not published? Ask us.
Related research
- Annual reportThe State of LinkedIn 2026: what works for everyday professionals40 findings from 134,522 posts, plus what works at each follower count.
- ReportDo AI-written LinkedIn posts get less engagement?AI-sounding posts get 22% less engagement, and the share of them peaked in 2024 to 2025.
- ReportEm dashes and AI: how often LinkedIn posts use themEm dash use rose sevenfold, then fell. The dash is a marker, not the problem.
- ReportHow long should a LinkedIn post be? What 134k posts showLonger posts win: 2,400+ characters +24% vs 600 to 900.
- ReportDo hashtags work on LinkedIn? What 134k posts showHashtags: no penalty, small lift. Tagging people: +35% to +126%.
Comments and reposts by format
Effects compare posts by the same author, 2024 to 2026. Ratios pool all 2025 to 2026 posts.
Documents are the most shared format: 8.4 reposts per 100 reactions, more than five times text-only posts. Text and document posts spark the most discussion per reaction; link previews the least.