
Key findings
- 134,522 posts from 1,499 profiles, January 2023 to September 2026.
- Every effect compares posts by the same author; every author counts once.
- Minimum 30 authors and 200 posts per published number.
- AI-judge labels calibrated by hand, with a published false-positive floor.
Contents
Where the data comes from
LigoSocial is an AI assistant for writing and scheduling LinkedIn posts. When users connect their LinkedIn profile, we store their public profile details and their recent public posts (up to 1,000 posts or two years at first fetch) with the reactions, comments and reposts each post had when we fetched it. This study uses those public posts of LigoSocial users who connected their own profile. We did not scrape anyone else, and we excluded the free LinkedIn Rewind tool, where non-users look up profiles.
How many users does that cover? 3,240 LigoSocial accounts have connected LinkedIn profile data (3,071 distinct profiles). Posts are stored for 1,572 distinct profiles. The rest either had no public posts of their own in the previous two years (our fetch returns nothing for them) or connected a profile without ever triggering a post fetch. After the cleaning steps below, 1,499 profiles have posts in the analysis window.
| Step | Posts |
|---|---|
| Posts stored for LigoSocial accounts that connected LinkedIn | 179,927 |
| Removed: accounts since deleted by their owners | -11,842 |
| Removed: company pages (we study people) | -1,843 |
| Removed: posts by another author (engaged-with, not written) | -251 |
| Removed: the same post stored under two accounts (agencies, team seats) | -4,927 |
| Unique posts by real people | 161,064 |
| Kept: the six main formats (text, image, document, video, link, poll) | 156,610 |
| Kept: posted January 2023 or later | 147,770 |
| Kept: 7+ days of engagement before our snapshot (analysis set) | 134,522 |
| Distinct LinkedIn profiles in the analysis set | 1,499 |
Snapshot taken on 25 September 2026.
Privacy
- Aggregates only. We never publish names, handles, post text, example posts or lists of top posts or creators.
- Minimum group sizes: every published number covers at least 30 authors and 200 posts, or 20 authors and 100 posts inside a follower band or region. Smaller cells are suppressed, not rounded.
- We never cross two small cuts (for example country by band by format).
- Accounts deleted by their owners are excluded entirely.
- Working files with post text were processed locally and deleted after the analysis.
- Our privacy policy covers publishing aggregated, anonymised statistics.
How we compare posts
Engagement is reactions + comments + reposts. We do not have views, saves or dwell time for most posts.
Within-author comparison. For each post we take log(1 + engagement) and subtract the average for the same author in the same year. A group's effect is the average of those differences, first within each author, then across authors, so every author counts once and a few big accounts cannot dominate. "+36% vs text" compares the same authors' image posts with their text-only posts. Comparing within the same year also removes follower growth over time.
Confidence intervals are 95% intervals from 400 bootstrap resamples of authors. Engagement snapshot: posts need at least 7 days between publishing and our engagement snapshot; posts can keep gaining engagement after that, which slightly understates totals for recent posts but affects all groups alike.
Local time uses the author's profile location, for single-time-zone countries plus US states, Canadian provinces and Australian states.
Follower growth uses monthly follower snapshots from June 2025 to August 2026 (months in which the person posted). Growth between consecutive months, and for longer histories the compound monthly growth from first to last snapshot.
How we set the follower bands
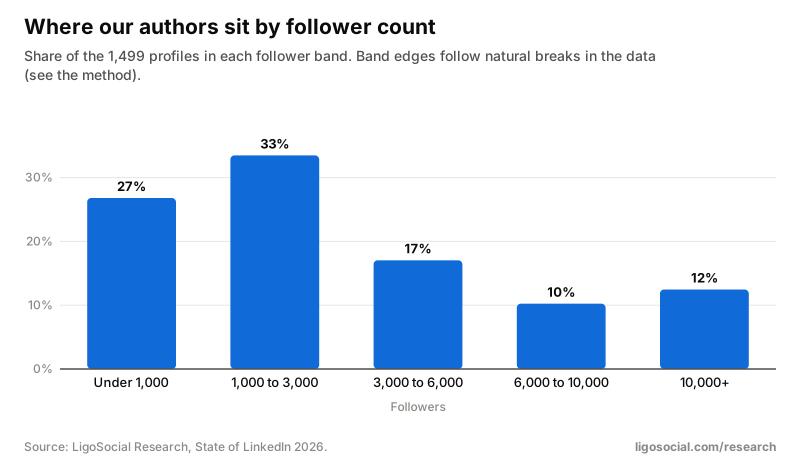
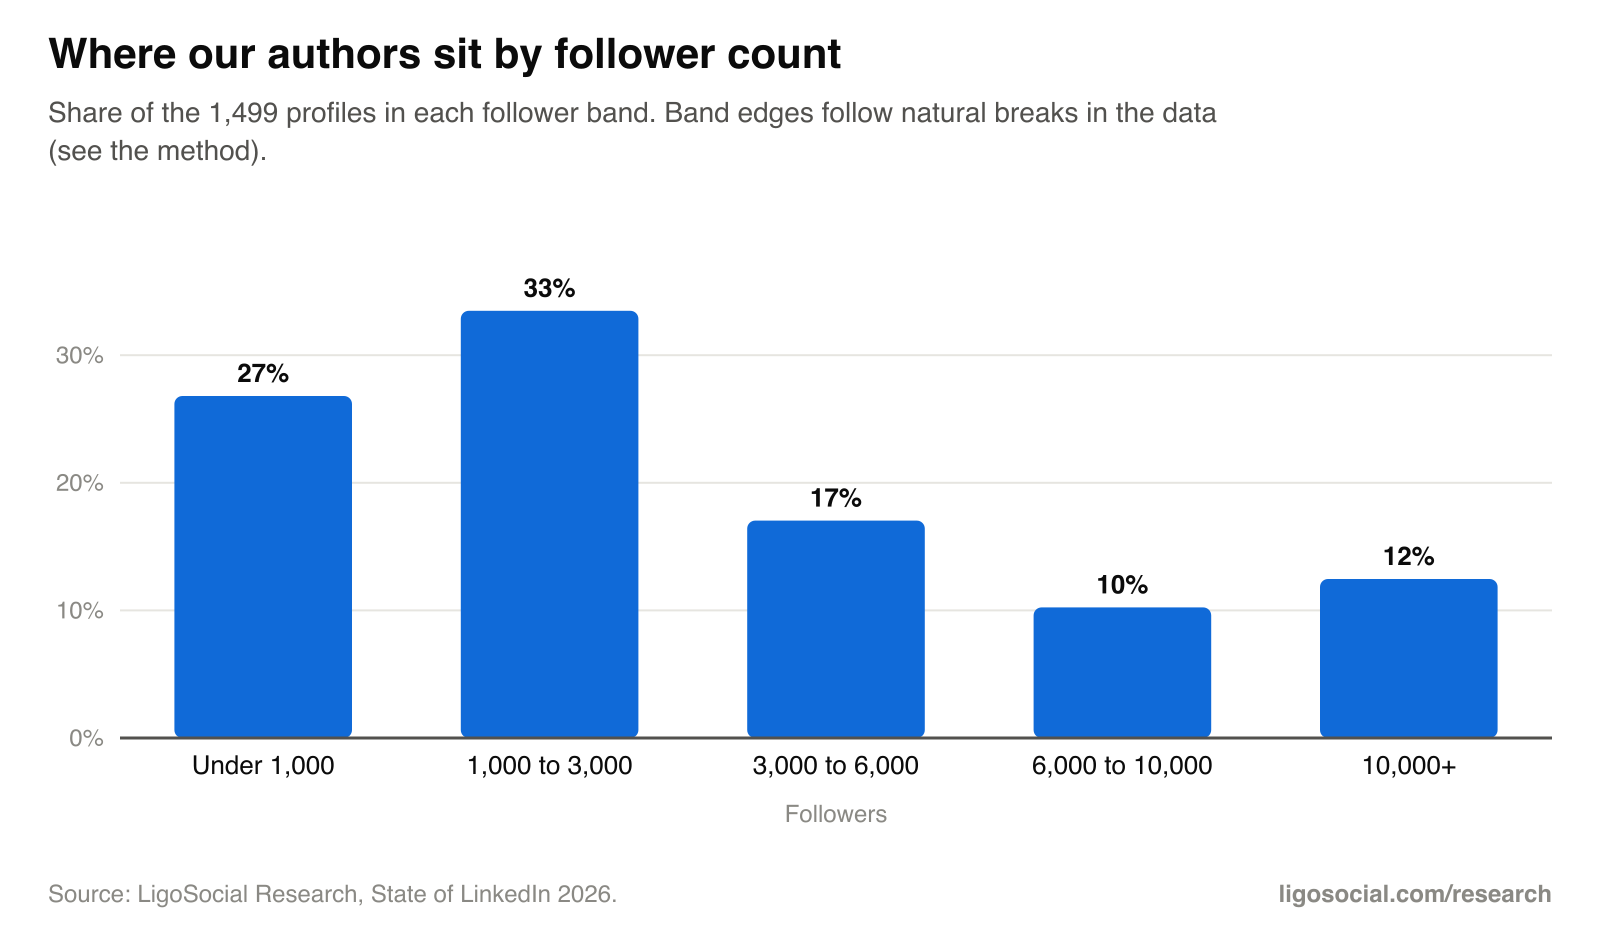
Follower counts are current. We plotted all profiles on a log scale and looked for natural breaks: a jump in profile counts at 1,000, a dip near 3,000, a second cluster from about 4,000 to 6,000 that thins after 6,000, and a tail past 10,000. Jenks natural breaks on the same data give about 760, 2,900 and 11,000 (four groups) or 1,350, 3,550 and 10,400 (six groups). We used 1,000, 3,000, 6,000 and 10,000.
Labelling posts with an AI judge
Post types, opening lines, topics, traits and "reads as AI" were labelled by Jev, a fast judgment model from TypeSafe that answers narrow questions with a probability, a choice or a score. It does not write. Each question was calibrated against posts we checked by hand before we trusted it (a single labeller; no post is quoted anywhere). Labels cover 47,160 posts from 1,294 authors for the AI and opening-line questions, and 41,938 posts from 398 authors (all of their eligible posts) for post type, topic and traits. Posts under 150 characters were not labelled.
| Question | Checked against | Result | Threshold |
|---|---|---|---|
| Reads as AI (score 0 to 3) | 40 random posts + 32 clear cases | AUC 0.86 and 0.99; flags 20% of 1,554 pre-ChatGPT posts (false-positive floor) | below 0.5 = AI-sounding; 1.5+ = clearly human |
| Opening line type (7 options) | 40 random posts | 95% agreement | most likely option |
| Post type (7 options) | 40 random posts | 93% agreement | most likely option |
| Topic (9 options) | 40 random posts | 88% agreement | most likely option |
| First-hand experience | 40 random + 30 stratified posts | 87% of flagged posts correct; about 1 in 5 first-hand posts missed | 0.5 |
| Contrarian stance | 40 random + 30 stratified posts | AUC 0.98; 87% of flagged posts correct | 0.8 |
| Concrete specifics | 40 random posts | AUC 0.99; 95% agreement | 0.8 |
| Promotional | 40 random posts | AUC 1.00; 97% agreement | 0.9 |
| Asks readers to comment | 40 random posts | AUC 0.92; 92% agreement | 0.9 |
| Link or contact call to action | 40 random posts | AUC 0.96; 92% agreement | 0.9 |
The "reads as AI" judge also scored 1,554 posts written before ChatGPT's release (November 2022). It flagged 20% of them. We publish that false-positive floor next to every AI trend.
Posts published through LigoSocial itself (1.3% of the analysis set) are excluded from the AI-writing and content-label analyses, so our own product cannot influence those results.
Limitations
- Observational data: associations, not proof of cause. Within-author comparisons remove many confounders, not all.
- Our authors chose an AI writing assistant, so they are more active and more AI-curious than the average LinkedIn member.
- No views, saves or dwell time; poll votes are not counted as engagement.
- Follower counts are current, and growth history covers about 15 months.
- 2026 covers January to September.
Reuse and citation
Everything here is free to use under CC BY 4.0. Please credit "LigoSocial Research" and link to the page you cite. The CSV files below hold every published number. If you spot an error, tell us at [email protected] and we will correct it and note the change.
Download the data
- CSV
All 40 findings with numbers and sample sizes
One row per finding.
40 rows, CSV
- CSV
Post format effects by follower band
Engagement vs the same author's text-only posts, 2024 to 2026.
41 rows, CSV
- CSV
Documents, video length and reposts by format
Effects vs the author's average post, plus comment and repost ratios.
21 rows, CSV
- CSV
Post length effects by follower band
Engagement vs the same author's 600 to 900 character posts.
48 rows, CSV
- CSV
Hashtags, emojis and tagging
Engagement vs the same author's posts with none.
32 rows, CSV
- CSV
Day, hour, region and posting gaps
Engagement vs the same author's average post (local time).
94 rows, CSV
- CSV
Engagement benchmarks by follower band
Typical author in each band, September 2025 to September 2026.
5 rows, CSV
- CSV
Follower growth by posting frequency and consistency
Median monthly follower growth, June 2025 to August 2026.
41 rows, CSV
- CSV
Share of posts that read as AI, by half-year
Posts of 300+ characters, calibrated judge, with the pre-ChatGPT false-positive baseline.
9 rows, CSV
- CSV
Em dashes and AI writing patterns, by half-year
Share of posts (150+ characters) using each pattern.
12 rows, CSV
- CSV
Post types, openings, topics, traits and the AI penalty
Labelled with a calibrated judge; within-author comparisons.
79 rows, CSV
Suggested citation
LigoSocial Research (2026). How we built the State of LinkedIn 2026 dataset. https://ligosocial.com/research/methodology
Free to reuse under CC BY 4.0: quote the numbers, embed the charts or rework the data, with credit to LigoSocial Research and a link to this page. Every figure is aggregated and anonymised; no individual, profile or post can be identified.
Does your next post read as AI?
Paste it into the free LinkedIn AI Detector. It scores the post and points at the phrases and patterns that give it away. Nothing you paste is stored.
How we collect, clean and anonymise the data: methodology. Questions or a cut we have not published? Ask us.
Related research
- Annual reportThe State of LinkedIn 2026: what works for everyday professionals40 findings from 134,522 posts, plus what works at each follower count.
- ReportDo AI-written LinkedIn posts get less engagement?AI-sounding posts get 22% less engagement, and the share of them peaked in 2024 to 2025.
- ReportEm dashes and AI: how often LinkedIn posts use themEm dash use rose sevenfold, then fell. The dash is a marker, not the problem.
- ReportLinkedIn post formats compared: images, carousels, video, text, links and pollsImages +36%, link previews -15%, polls -50%. Carousels only pay past 10 pages.
- ReportHow long should a LinkedIn post be? What 134k posts showLonger posts win: 2,400+ characters +24% vs 600 to 900.