
Key findings
- Monthly follower growth: 1.2% at 1 to 2 posts a month, 2.1% at 21+.
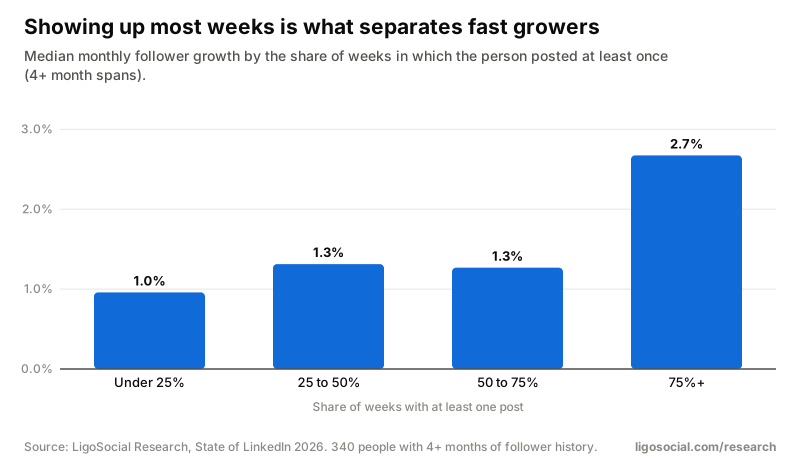
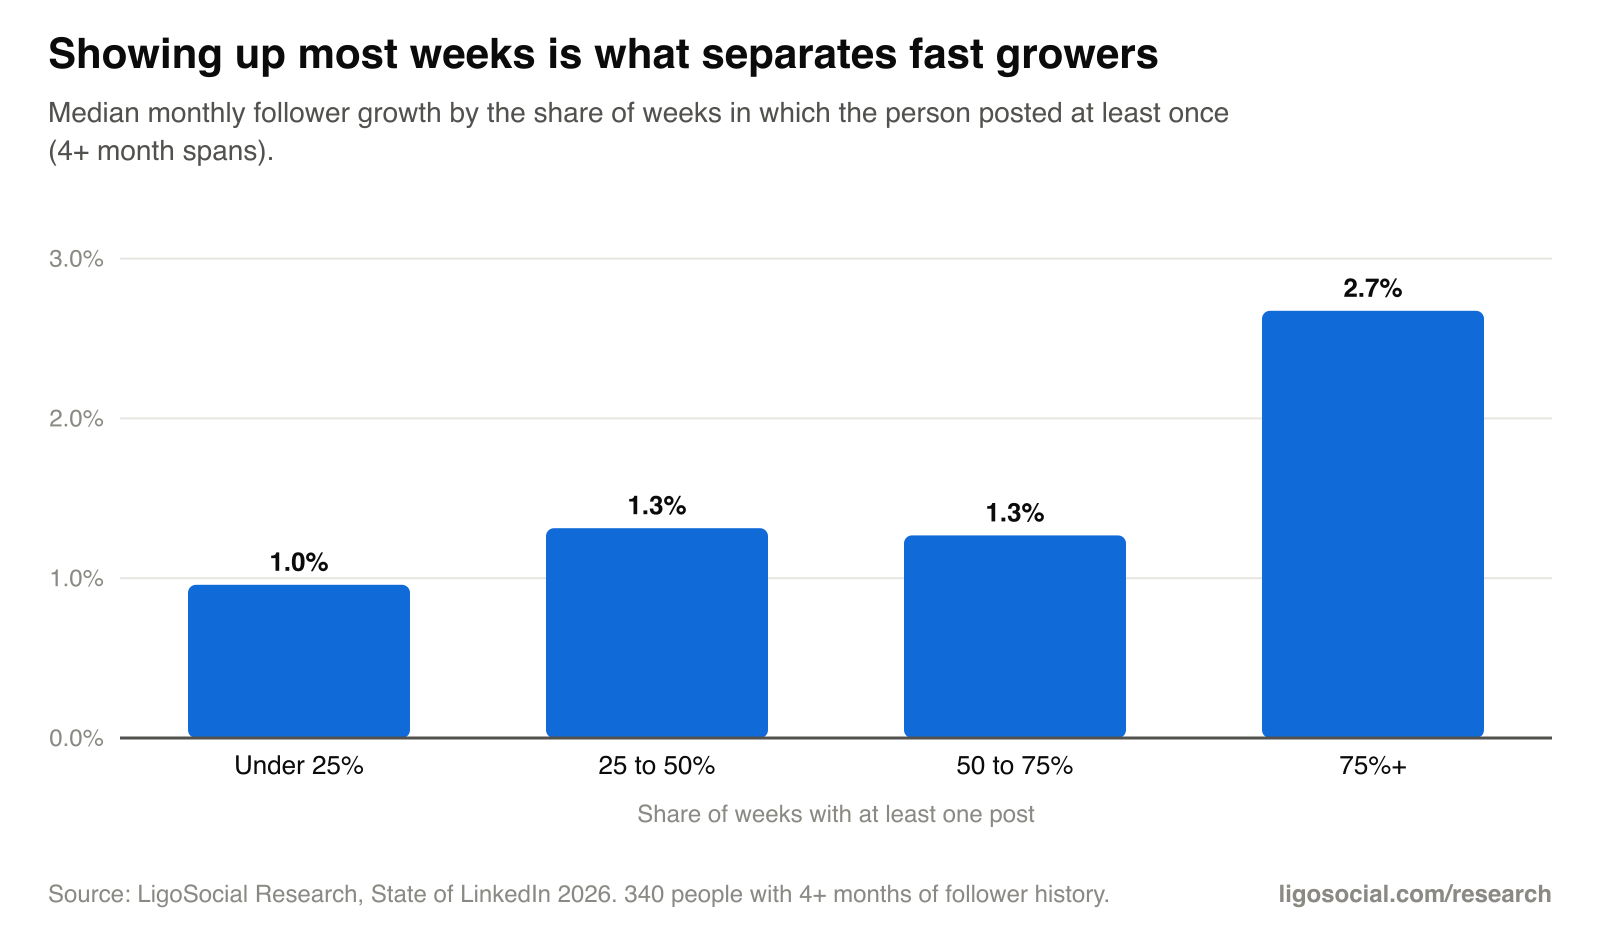
- Posting in 75%+ of weeks: 2.7% a month vs 1.0%.
- Fastest growers posted 7.6 times a month vs 3.2, with longer streaks.
- Each extra post in a week earns less per post, and a second post within 24 hours gets -10%.
Contents
The short answer
Post most weeks, and space your posts out. People who posted in 75% or more of weeks grew their followers 2.7% a month (median), vs 1.0% for people who posted in fewer than a quarter of weeks. Months with 21+ posts grew 2.1% vs 1.2% with 1 or 2 posts. But posting twice in a day hurts the second post, and past about 4 posts a week each post earns noticeably less.
Posts per month and follower growth
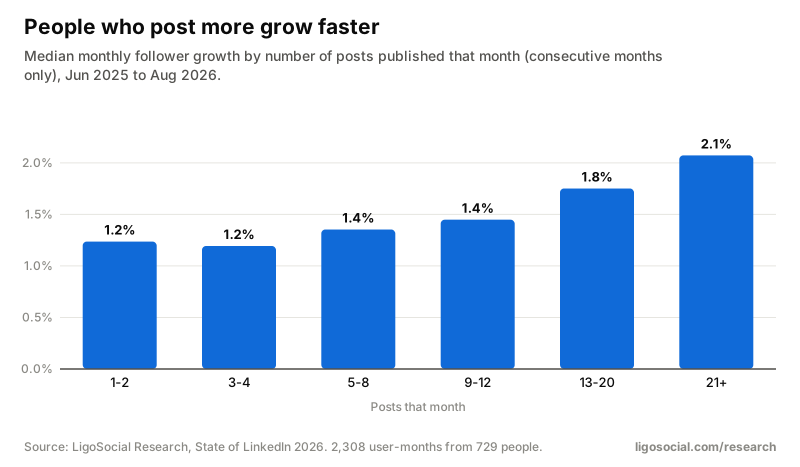
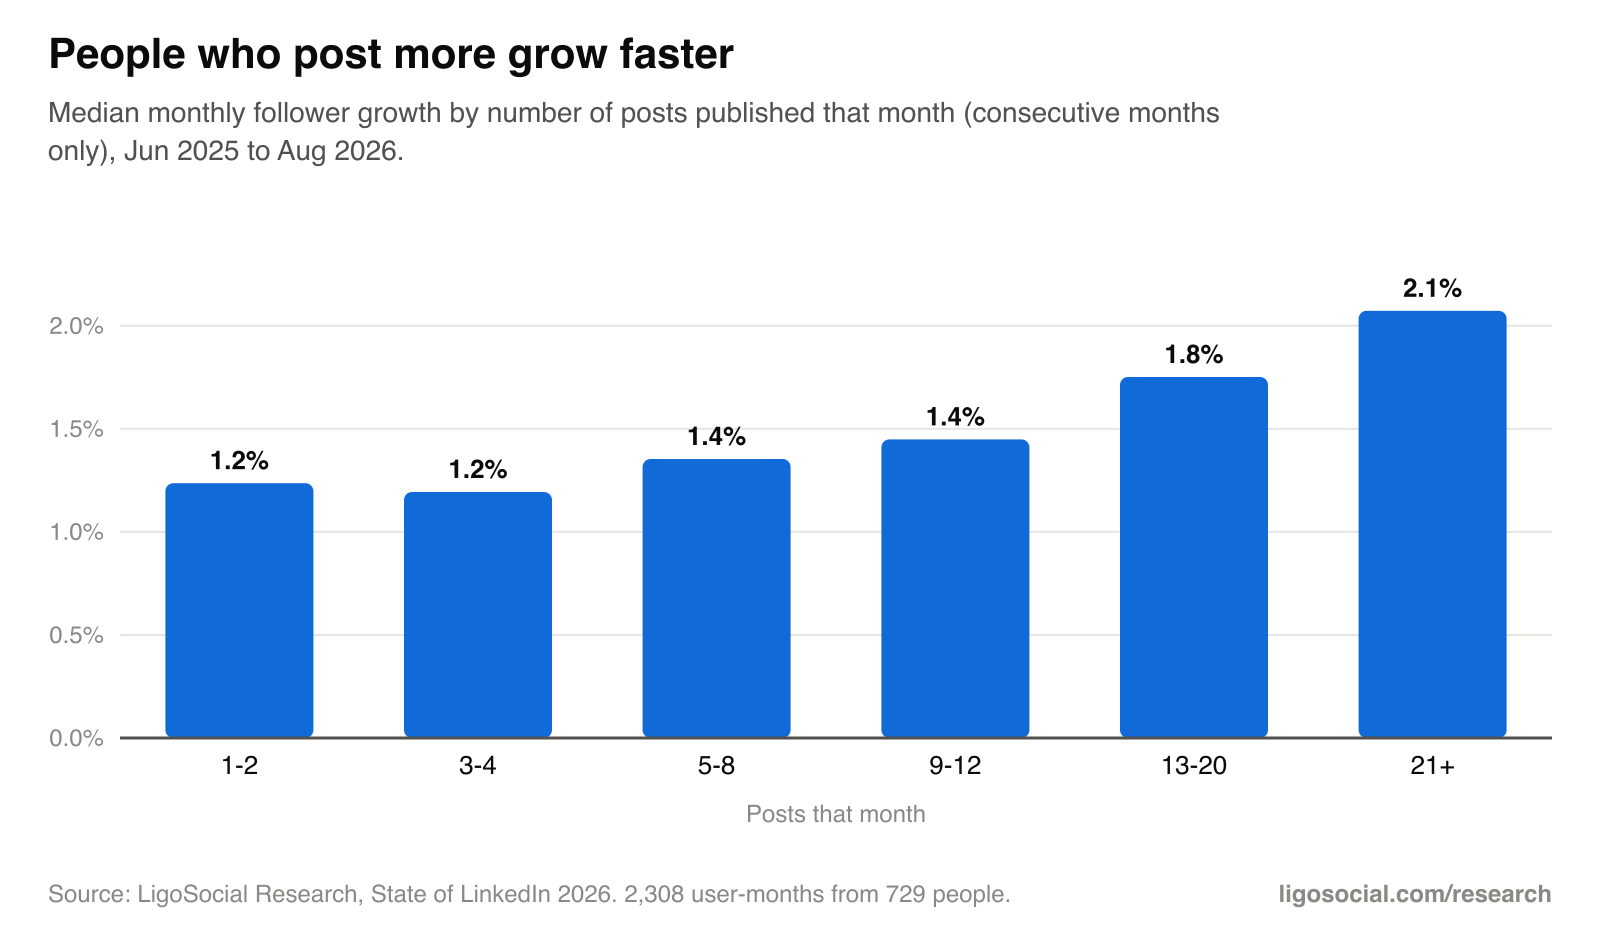
| Posts that month | People | Months | Median growth |
|---|---|---|---|
| 1-2 | 556 | 798 | 1.2% |
| 3-4 | 173 | 288 | 1.2% |
| 5-8 | 196 | 370 | 1.4% |
| 9-12 | 130 | 229 | 1.4% |
| 13-20 | 132 | 281 | 1.8% |
| 21+ | 97 | 342 | 2.1% |
Consecutive months with follower snapshots, June 2025 to August 2026.
| Followers | 1-2 | 3-4 | 5-8 | 9-12 | 13-20 | 21+ |
|---|---|---|---|---|---|---|
| Under 1,000 | 2.1% | 3.7% | 4.4% | n/a | n/a | n/a |
| 1,000 to 3,000 | 1.4% | 1.8% | 1.7% | 2.5% | 3.7% | 3.2% |
| 3,000 to 6,000 | 1.3% | 1.6% | 2.1% | 2.1% | 2.5% | 3.0% |
| 6,000 to 10,000 | 1.0% | 1.1% | 0.8% | 1.2% | 1.1% | n/a |
| 10,000+ | 0.8% | 0.5% | 0.6% | 0.5% | 0.8% | 0.9% |
n/a: fewer than 20 people.
The link between volume and growth is strongest under 6,000 followers. At 10,000+ followers, growth barely changes with posting frequency.
The per-post cost of posting more
-31%
Finding 30
More posts per week means less per post, but more in total
In weeks with 2 posts, each post got -9% vs single-post weeks; 3 to 4 posts -16%; 5 to 7 posts -23%. Even at 5 to 7 posts a week, total weekly engagement is several times a single post.
-10%
Finding 29
Posting twice in 24 hours costs the second post
Posts made within 24 hours of the author's previous post got -10% vs posts made 2 to 4 days after the last one (95% CI -13% to -7%).
What the fastest growers did
7.6 vs 3.2 posts/month
Finding 38
What the fastest growers did differently
The fastest-growing 20% (within their follower band) posted 7.6 times a month vs 3.2, in 69% of weeks vs 39%, with a longest weekly streak of 13 weeks vs 6. They used more images (61% of posts vs 47%), fewer link posts (2% vs 5%) and posted more on weekends (13% vs 8%). Post length was the same.
2.7% vs 1.0%
Finding 37
Consistency is the strongest growth signal
People who posted in at least 75% of weeks grew 2.7% a month (median) vs 1.0% for those who posted in fewer than 25% of weeks.
Correlation, not a promise
What to do
Post what the data says works, in your own voice
LigoSocial learns how you write from your own LinkedIn posts, then drafts posts, comments and replies in that voice right inside LinkedIn. You approve what goes out.
Add LigoSocial to ChromeOr try it at ligosocial.comCommon questions
- How often should you post on LinkedIn?
- Most weeks, with at least a day between posts. People who posted in 75%+ of weeks grew 2.7% a month vs 1.0% for rare posters. 3 to 5 posts a week is a good target under 6,000 followers.
- Is posting on LinkedIn every day too much?
- Daily posting is fine if the posts are good, but each extra post in a week earns less: weeks with 5 to 7 posts saw each post get -23% vs single-post weeks. Total weekly engagement still rises.
- How fast do LinkedIn followers grow?
- Median monthly growth in our data: Under 1,000 followers 3.5%, 1,000 to 3,000 followers 1.9%, 3,000 to 6,000 followers 2.0%, 6,000 to 10,000 followers 1.1%, 10,000+ followers 0.7%.
Download the data
Suggested citation
LigoSocial Research (2026). How often should you post on LinkedIn? Frequency, consistency and follower growth. https://ligosocial.com/research/how-often-to-post-on-linkedin
Free to reuse under CC BY 4.0: quote the numbers, embed the charts or rework the data, with credit to LigoSocial Research and a link to this page. Every figure is aggregated and anonymised; no individual, profile or post can be identified.
Does your next post read as AI?
Paste it into the free LinkedIn AI Detector. It scores the post and points at the phrases and patterns that give it away. Nothing you paste is stored.
How we collect, clean and anonymise the data: methodology. Questions or a cut we have not published? Ask us.
Related research
- Annual reportThe State of LinkedIn 2026: what works for everyday professionals40 findings from 134,522 posts, plus what works at each follower count.
- ReportDo AI-written LinkedIn posts get less engagement?AI-sounding posts get 22% less engagement, and the share of them peaked in 2024 to 2025.
- ReportEm dashes and AI: how often LinkedIn posts use themEm dash use rose sevenfold, then fell. The dash is a marker, not the problem.
- ReportLinkedIn post formats compared: images, carousels, video, text, links and pollsImages +36%, link previews -15%, polls -50%. Carousels only pay past 10 pages.
- ReportHow long should a LinkedIn post be? What 134k posts showLonger posts win: 2,400+ characters +24% vs 600 to 900.