
Key findings
- Typical engagement rate: 0.48% of followers per post (top quarter 1.1%).
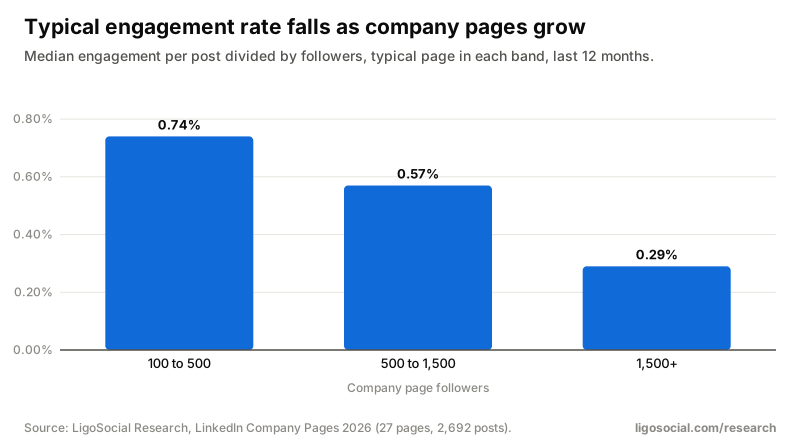
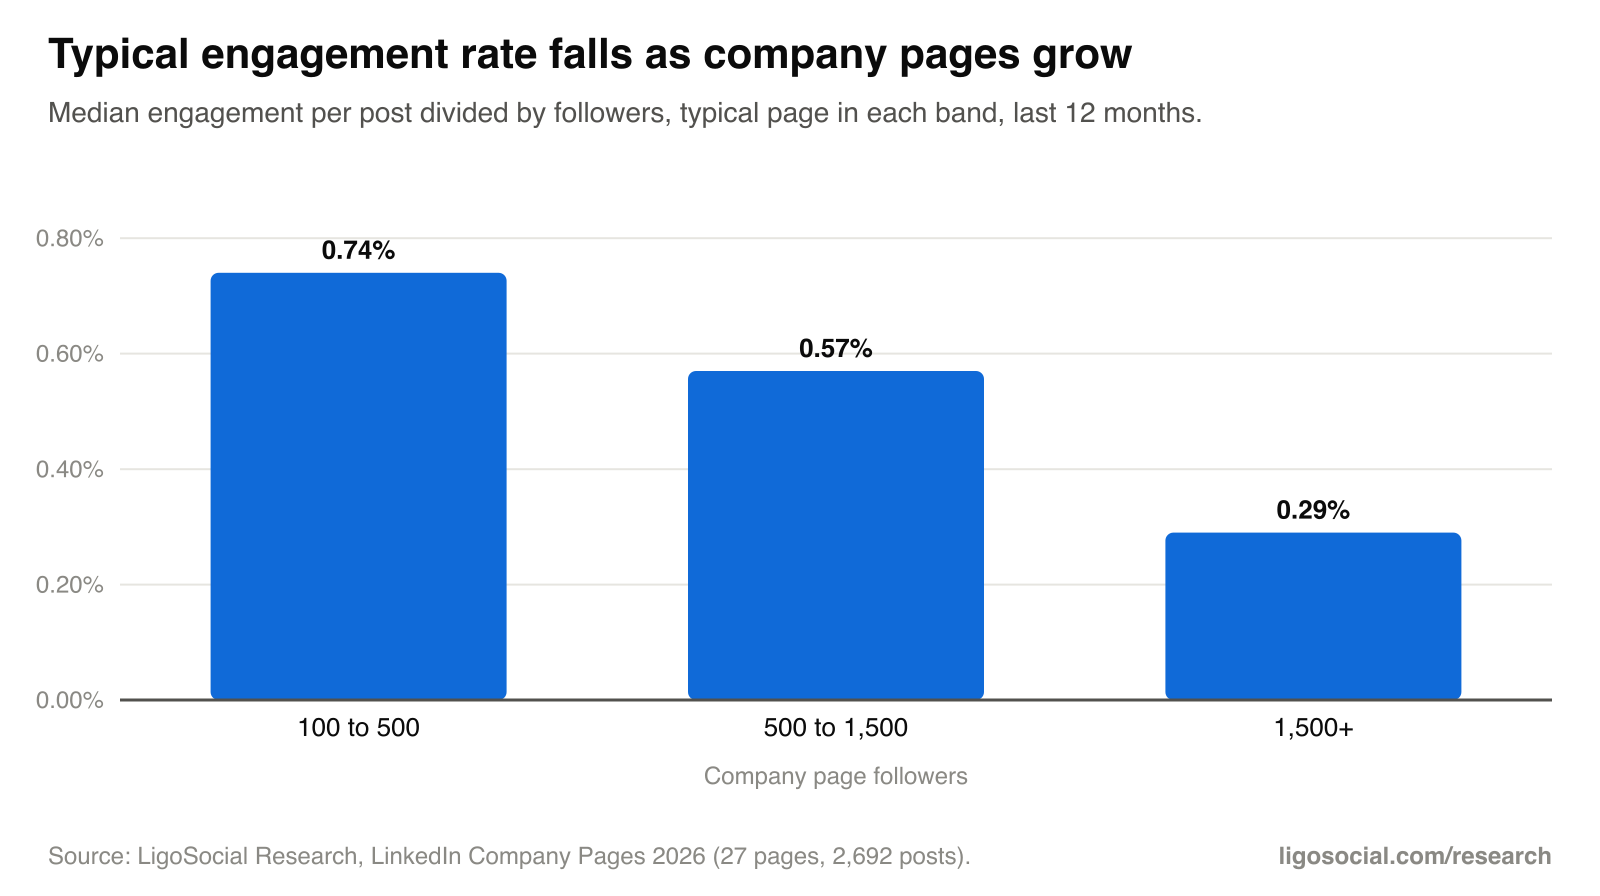
- By band: 0.74% at 100 to 500 followers, 0.57% at 500 to 1,500, 0.29% at 1,500+.
- Past 1,000 followers, pages match personal profiles per follower (0.42% vs 0.43%).
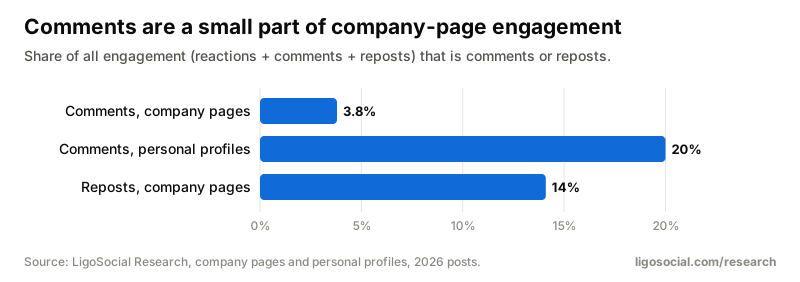
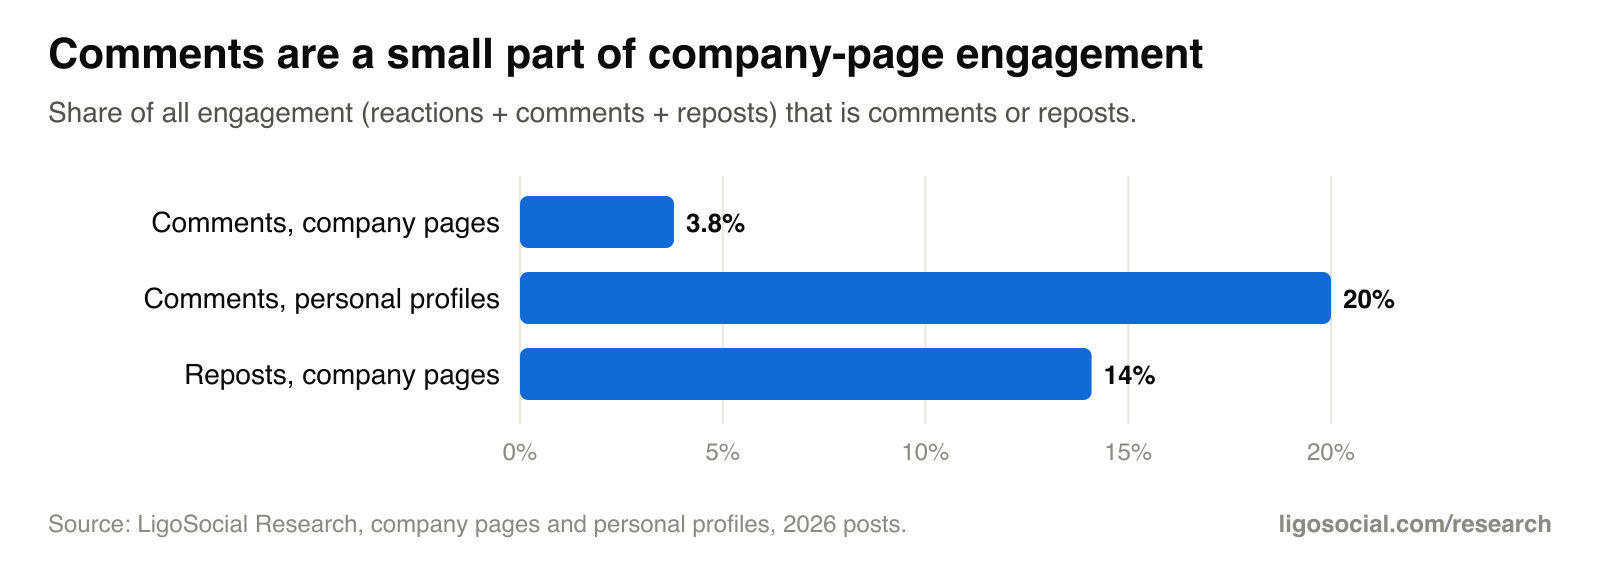
- Comments are only 4% of company-page engagement (20% for people); reposts are 14%.
The short answer
A good engagement rate for a small or mid-size LinkedIn company page is around 0.5% of followers per post, and anything above 1% puts a page in the top quarter. We measured it as the typical post's reactions + comments + reposts divided by followers, over the last 12 months, for 27 company pages we selected for this study.
| Followers | Pages | Engagement per post | Engagement rate | Top 25% rate | Posts per month |
|---|---|---|---|---|---|
| 100 to 500 | 9 | 2 | 0.74% | 1.33% | 4.4 |
| 500 to 1,500 | 10 | 7 | 0.57% | 2.01% | 2.4 |
| 1,500+ | 8 | 18 | 0.29% | 0.49% | 3.2 |
| All pages | 27 | 4.5 | 0.48% | 1.10% | 3.0 |
Typical = the median page. Engagement per post is each page's median post. Rates use current follower counts.
Company pages vs personal profiles
Per follower, company pages are not as far behind as people think. Pages with 1,000 to 3,000 followers had a typical rate of 0.42%, level with personal profiles of the same size (0.43%) in our State of LinkedIn 2026 study. Below 1,000 followers pages trail: 0.77% vs 0.96%.
The real difference is what kind of engagement pages get. Comments are 3.8% of company-page engagement vs 20% for people, and 72% of company posts get no comment at all. Reposts are 14% of engagement: 17 per 100 reactions, several times the personal-profile rate, mostly employees and partners passing posts on.
| Measure | Company pages | Personal profiles |
|---|---|---|
| Typical engagement per post | 4.5 | 10 |
| Typical engagement rate (per follower) | 0.48% | 0.32% |
| Engagement rate at 1,000 to 3,000 followers | 0.42% | 0.43% |
| Comments as a share of engagement | 4% | 20% |
| Posts that read as AI (2026 H1) | 73% | 41% |
| Posts with an em dash (2026) | 29% | 20% |
| Best opening line | News or announcement | A story |
| Ending with a request to comment | -11% comments | no change (+2%) |
| Tagging people | +57% to +87% | +35% to +126% |
| Link preview posts | -30% vs images | -15% vs text |
| Timing | 4 to 6pm best, before 8am worst | hour barely matters; Sunday +9% |
| Hashtags per post (median) | 6 | most posts use none |
Personal-profile figures are from our State of LinkedIn 2026 study. Company pages have a median of 1,046 followers; the personal profiles a median of about 2,000, so compare rates, not raw counts.
How to raise your rate
Full detail for every finding is in the main report.
Post what the data says works, in your own voice
LigoSocial learns how you write from your own LinkedIn posts, then drafts posts, comments and replies in that voice right inside LinkedIn. You approve what goes out.
Add LigoSocial to ChromeOr try it at ligosocial.comCommon questions
- What is a good engagement rate on a LinkedIn company page?
- Around 0.5% of followers per post is typical for small and mid-size pages; above 1% is top quarter.
- Why is my LinkedIn company page engagement so low?
- Company pages get few comments (4% of engagement) and most posts are generic thought leadership or product posts. Posts featuring people, news and events earn far more, and link previews and AI-sounding copy earn less.
- How do you calculate LinkedIn company page engagement rate?
- Reactions + comments + reposts on a post, divided by the page's followers. We use each page's median post over 12 months so one viral post does not skew it.
Download the data
Suggested citation
LigoSocial Research (2026). LinkedIn company page engagement rate benchmarks 2026. https://ligosocial.com/research/linkedin-company-page-engagement-rate
Free to reuse under CC BY 4.0: quote the numbers, embed the charts or rework the data, with credit to LigoSocial Research and a link to this page. Every figure is aggregated and anonymised; no individual, profile or post can be identified.
Does your next post read as AI?
Paste it into the free LinkedIn AI Detector. It scores the post and points at the phrases and patterns that give it away. Nothing you paste is stored.
How we collect, clean and anonymise the data: methodology. Questions or a cut we have not published? Ask us.
Related research
- ReportLinkedIn Company Pages 2026: what works for small and mid-size brands27 selected company pages, 2,692 posts: benchmarks by follower band, what to post, formats, timing, AI, and how pages differ from people.
- ReportBest time to post on a LinkedIn company page: 2,460 posts in local time4 to 6pm local time +19%, before 8am -29%; weekdays are all about the same; posting more did not hurt.
- ReportWhat to post on a LinkedIn company page: content types ranked by engagementTeam posts +156% and news +100% vs product posts; thought leadership, the most common post, -24%.
- Annual reportThe State of LinkedIn 2026: what works for everyday professionals40 findings from 134,522 posts, plus what works at each follower count.
- ReportLinkedIn post formats compared: images, carousels, video, text, links and pollsImages +36%, link previews -15%, polls -50%. Carousels only pay past 10 pages.
- ReportDo AI-written LinkedIn posts get less engagement?AI-sounding posts get 22% less engagement, and the share of them peaked in 2024 to 2025.