
Key findings
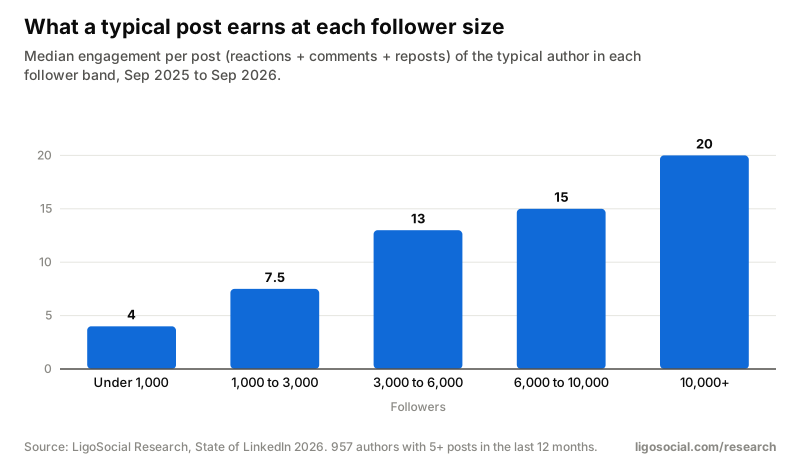
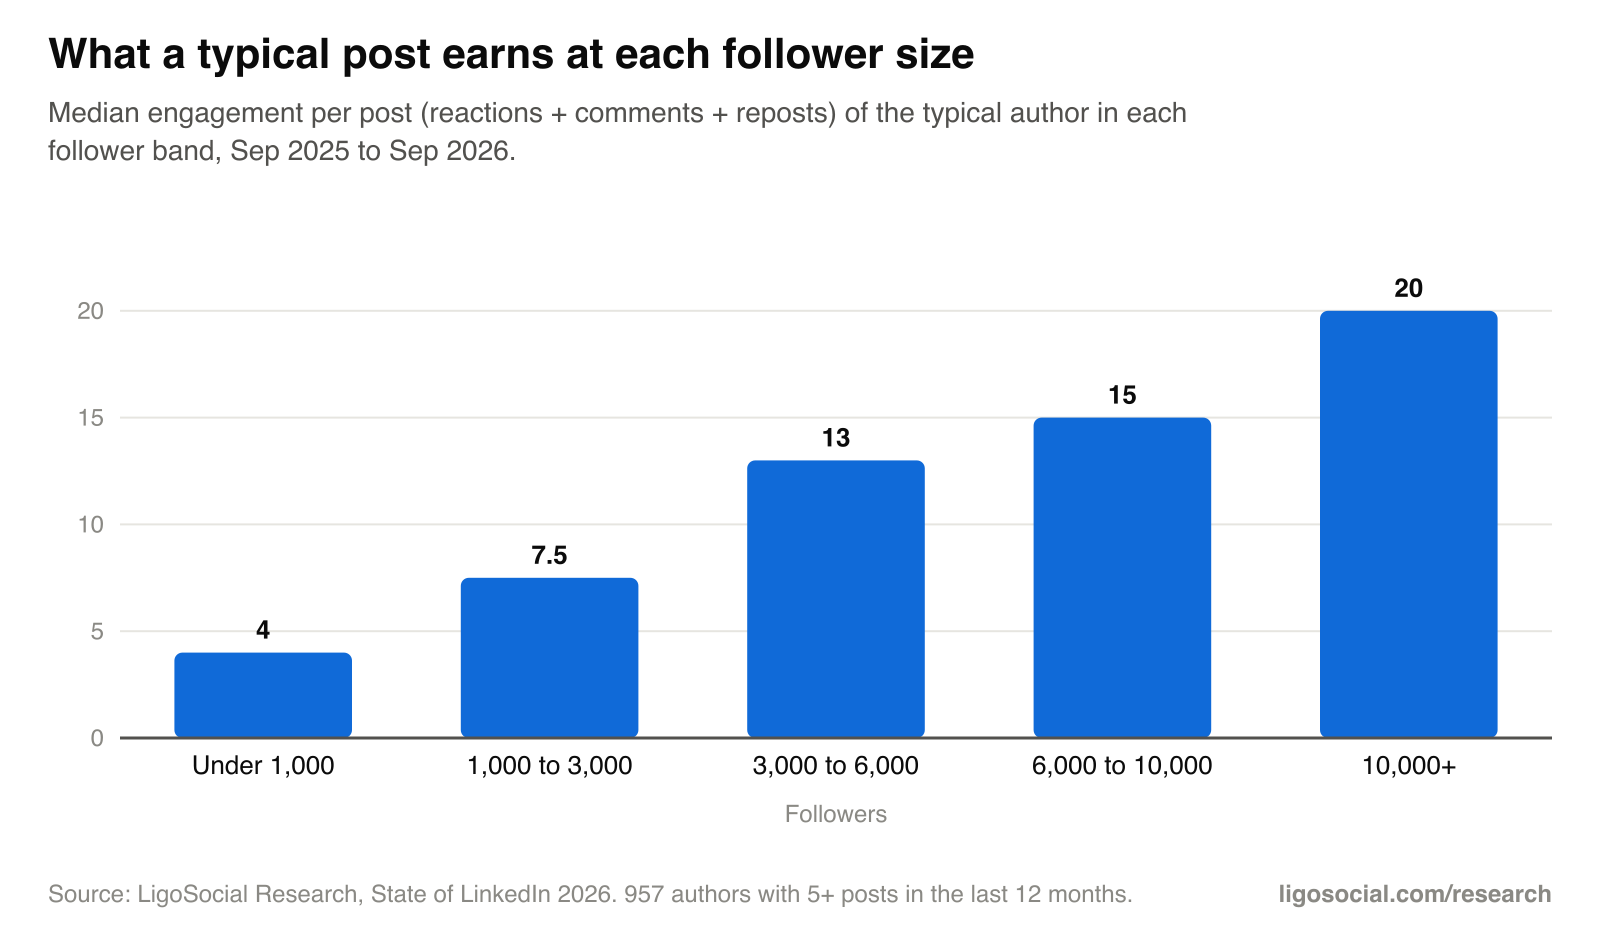
- Typical engagement per post: Under 1,000 4, 1,000 to 3,000 7.5, 3,000 to 6,000 13, 6,000 to 10,000 15, 10,000+ 20.
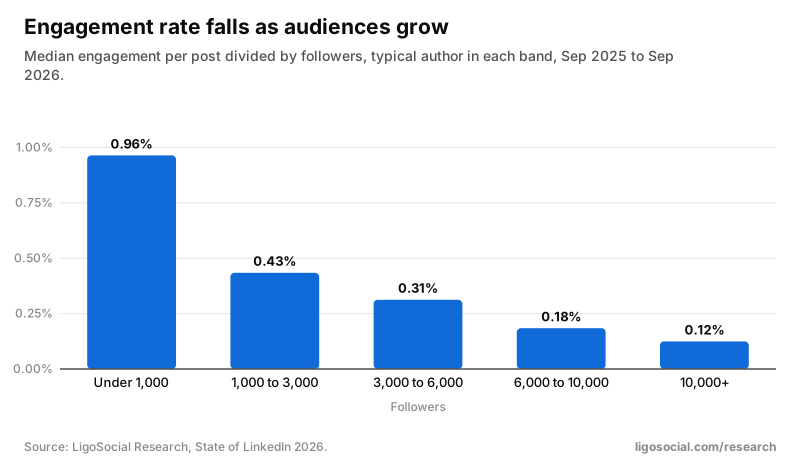
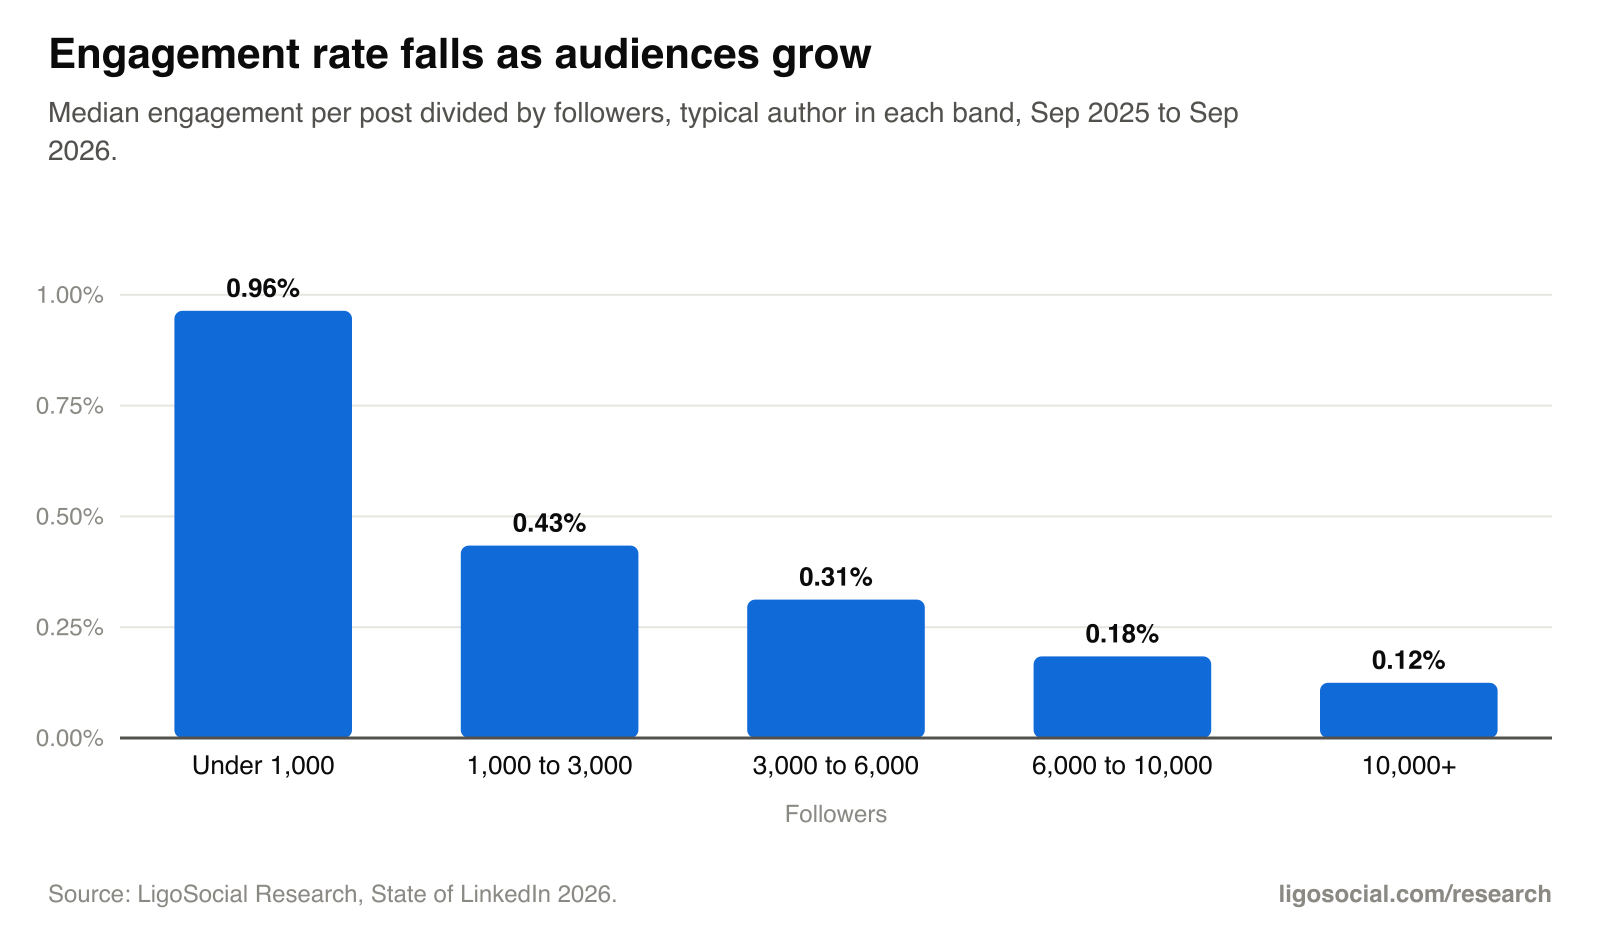
- Typical engagement rate falls from 0.96% (under 1,000 followers) to 0.12% (10,000+).
- The same authors got +6% engagement per post in 2025 vs 2024; comments rose to 20% of engagement.
Contents
The short answer
For everyday professionals, a typical post earns 10 reactions, comments and reposts, and the typical author's engagement rate (engagement per post divided by followers) is 0.32%. The top quarter of authors get 0.83% or more. Rates are much higher for small accounts and fall steadily as audiences grow, so compare yourself with your own band.
Benchmarks by follower band
| Followers | Authors | Median engagement | Top 25% | Top 10% | Median comments | Top 25% comments | Median rate | Top 25% rate |
|---|---|---|---|---|---|---|---|---|
| Under 1,000 | 173 | 4 | 10 | 19 | 0 | 0.5 | 0.96% | 2.17% |
| 1,000 to 3,000 | 304 | 7.5 | 15.5 | 36.85 | 0 | 1.5 | 0.43% | 0.98% |
| 3,000 to 6,000 | 194 | 13 | 28 | 51.4 | 1 | 3 | 0.31% | 0.64% |
| 6,000 to 10,000 | 121 | 15 | 33 | 55.5 | 1 | 3.5 | 0.18% | 0.42% |
| 10,000+ | 165 | 20 | 48.5 | 135.2 | 2 | 6 | 0.12% | 0.28% |
For each author we take the median post, then report the median (and 75th/90th percentile) across authors. Engagement = reactions + comments + reposts. Rate = engagement / followers. Authors with 5+ posts.
Why engagement rate is a poor comparison across sizes
A 1% engagement rate is ordinary under 1,000 followers (0.96% median) and exceptional above 10,000 (0.12% median, 0.28% for the top quarter). Follower counts include old connections and inactive accounts, and that share grows with network size. Benchmark yourself against your band, or against your own last 20 posts.
Did LinkedIn engagement really drop?
+6%
Finding 33
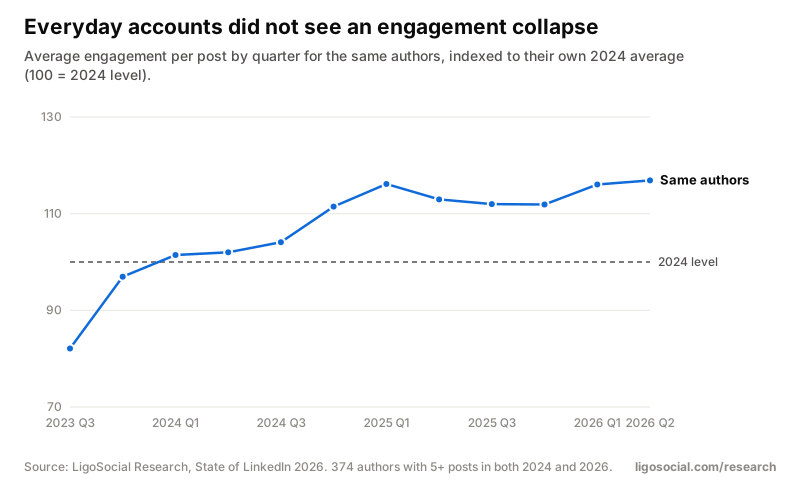
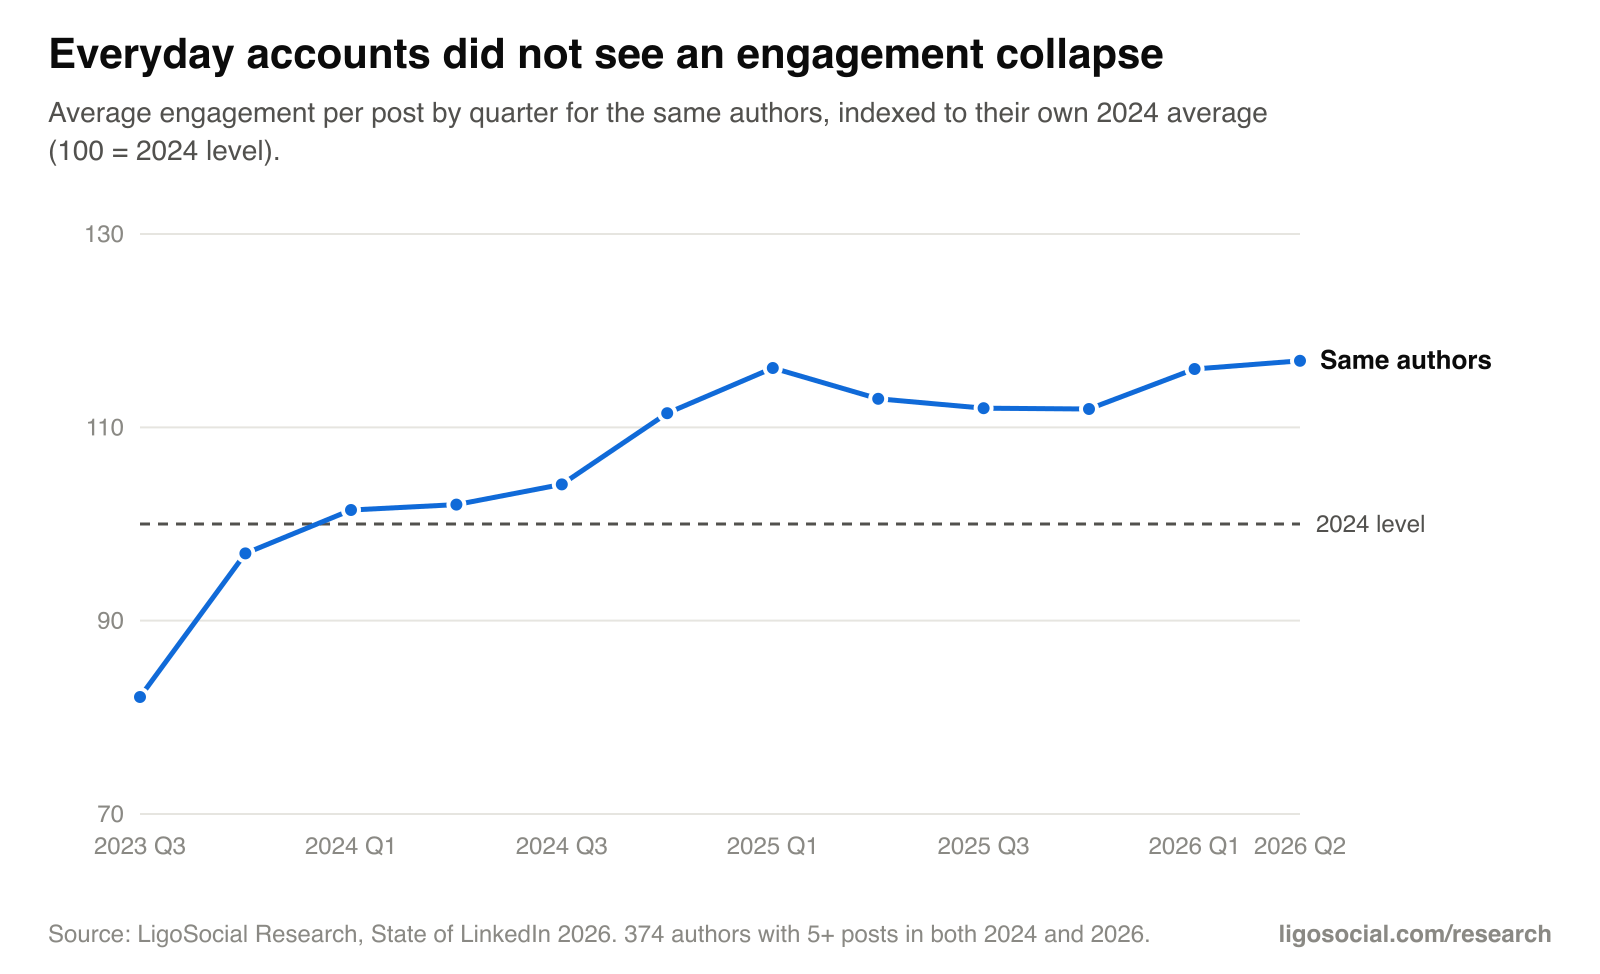
Everyday accounts did not see an engagement collapse
The same 372 people got +6% engagement per post in 2025 vs 2024 (95% CI 0% to +14%) and +7% in 2026 so far (CI -2% to +16%). Comments rose +13%. Headlines about engagement falling 25% or more describe big creators and views, not everyday professionals.
11% to 20%
Finding 34
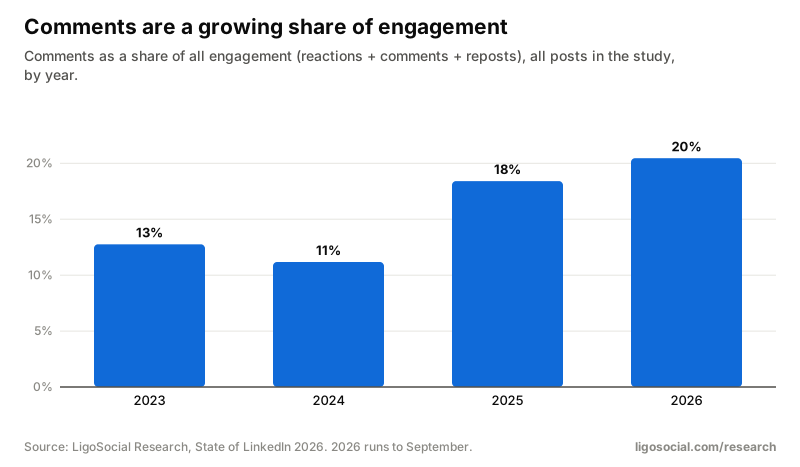
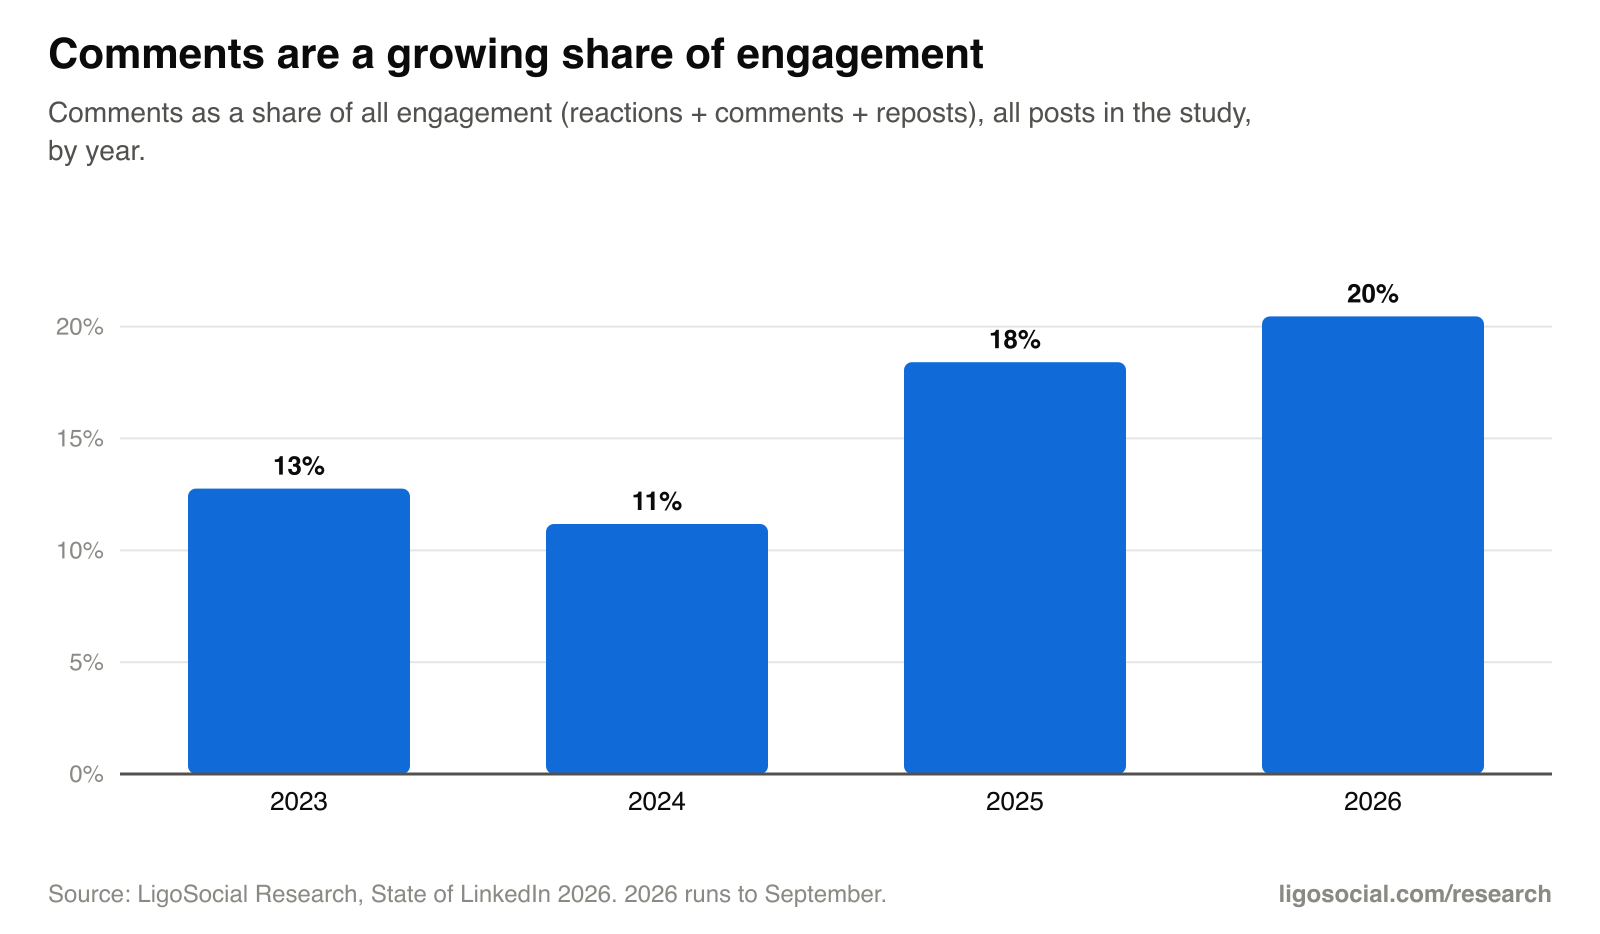
Comments doubled their share of engagement
Comments were 11% of all engagement in 2024, 18% in 2025 and 20% in 2026.
How to use these benchmarks
Post what the data says works, in your own voice
LigoSocial learns how you write from your own LinkedIn posts, then drafts posts, comments and replies in that voice right inside LinkedIn. You approve what goes out.
Add LigoSocial to ChromeOr try it at ligosocial.comCommon questions
- What is a good engagement rate on LinkedIn?
- It depends on your size. The typical author's rate is 0.96% under 1,000 followers, 0.43% at 1,000 to 3,000, 0.31% at 3,000 to 6,000, 0.18% at 6,000 to 10,000 and 0.12% at 10,000+. Top-quarter authors roughly double those.
- How is LinkedIn engagement rate calculated?
- Here: (reactions + comments + reposts) on a post divided by the author's followers. Some tools divide by impressions instead, which gives a different, usually higher, number.
- Is LinkedIn engagement down in 2026?
- Not for the everyday accounts we track: the same people got +6% engagement per post in 2025 vs 2024 and +7% so far in 2026, with comments up 13%.
Download the data
Suggested citation
LigoSocial Research (2026). What is a good LinkedIn engagement rate? Benchmarks by follower count. https://ligosocial.com/research/linkedin-engagement-benchmarks
Free to reuse under CC BY 4.0: quote the numbers, embed the charts or rework the data, with credit to LigoSocial Research and a link to this page. Every figure is aggregated and anonymised; no individual, profile or post can be identified.
Does your next post read as AI?
Paste it into the free LinkedIn AI Detector. It scores the post and points at the phrases and patterns that give it away. Nothing you paste is stored.
How we collect, clean and anonymise the data: methodology. Questions or a cut we have not published? Ask us.
Related research
- Annual reportThe State of LinkedIn 2026: what works for everyday professionals40 findings from 134,522 posts, plus what works at each follower count.
- ReportDo AI-written LinkedIn posts get less engagement?AI-sounding posts get 22% less engagement, and the share of them peaked in 2024 to 2025.
- ReportEm dashes and AI: how often LinkedIn posts use themEm dash use rose sevenfold, then fell. The dash is a marker, not the problem.
- ReportLinkedIn post formats compared: images, carousels, video, text, links and pollsImages +36%, link previews -15%, polls -50%. Carousels only pay past 10 pages.
- ReportHow long should a LinkedIn post be? What 134k posts showLonger posts win: 2,400+ characters +24% vs 600 to 900.