
Understanding Your Analytics, Cognitive Dashboard, and LigoBrain
LigoSocial gives you two views of how you show up on LinkedIn. Analytics shows how your posts and audience are performing. LigoBrain shows how well LigoSocial knows you: the facts, opinions, stories and style it draws on when it writes in your voice. This guide explains what each view shows, what the main numbers mean and how the data updates.
Both are in the sidebar: click Analytics or LigoBrain.
Analytics
Open Analytics from the sidebar (or https://app.ligosocial.com/linkedin-analytics). The page has four tabs:
- Overview: your headline numbers and patterns
- Top Posts: your individual posts, searchable and sortable
- AI Insights: recommendations built from your posts
- Monthly Reports: a shareable summary for one month
If your account is set up for a LinkedIn Company Page, Analytics opens company analytics instead, with the tabs Overview, Posting Timeline and AI Insights. See Step-by-step LinkedIn Company Page setup.
The header
At the top you will see:
- Sync status: when your LinkedIn data was last synced, for example "Synced Oct 6", or Not synced yet. If automatic syncing is on, it also shows Next sync in with the time left.
- Your timezone as a GMT offset. Day and time charts use your local time.
- A date range selector (on Overview and AI Insights): Last 7 Days, Last 30 Days, 90 Days, 180 Days, 365 Days or All Time. Longer ranges are available on plans that include them; locked ranges show which plan they need. See Billing in the app.
- Chat with Your Data: ask questions about your performance in plain language, for example "Which content type works best for me?" or "When do my posts get the most engagement?"
If you have no posts in the selected range, you may see a sample dashboard with a "You're viewing sample data" banner. That is example data, not yours.
Overview
Quick insight cards
- Best Day to Post: the weekday with your highest average engagement.
- Peak Time: the time window with your highest average engagement, in your local time.
- Media Boost: how much more (or less) engagement posts with images or video get compared with text-only posts.
- Optimal Length: the post length that works best for you. Short is under 100 words, medium about 150 to 250, long 300 or more.
Audience and per-post stats
- Total Followers and Total Connections: your latest synced numbers.
- Reactions / Post and Comments / Post: averages for the selected range.
Charts
- Day of Week Performance and Time of Day Performance: average engagement by day and by time window. Use them to pick posting slots.
- Media Impact: posts with media compared with text-only posts.
- Post Length Impact: short, medium and long posts compared.
- Engagement Totals: total reactions, comments and reposts.
- Reaction Types: which reactions your posts earned (like, celebrate, support, insightful and so on).
- Content Types: the share of your posts that were images, video or text only.
- Engagement Over Time: engagement across the range, viewable as Total, Weekly or Monthly, with a trend label (Growing, Declining or Stable) and your Best Period.
Top Posts
A list of your LinkedIn posts. You can search, sort by date or engagement, filter by content type, and add labels to posts.
Each post shows when it went out, its type, reactions, comments and impressions (when LinkedIn provides them). Posts with at least twice your average engagement get a Top Post badge.
From any post you can click Repurpose to turn it into a new post, or use the menu to Save to Drafts, Copy Text or View on LinkedIn.
AI Insights
Click Generate Insights. LigoSocial analyzes up to your 50 most recent posts in the selected range, which usually takes 20 to 40 seconds. Results are grouped into High Priority, Medium Priority and Low Priority action items. Open a card to see the recommended action and the data behind it.
Insights are generated on demand. They reflect your data at the moment you generate them, so generate again after you have posted more.
Monthly Reports
A one-page summary for a month you choose, which you can download with Export PDF. Monthly Reports are available on plans that include them (see Billing in the app), and a new report appears after each full month. Each report includes:
- Performance Highlights: posts published, average engagement per post, total reactions and posting frequency, each compared with the previous month
- Best Performing Post
- Best Posting Day & Times
- Which post types perform best?: images, video and text-only compared
- Audience Snapshot: followers and connections
Agencies can add their own name and logo to client reports from the Agency Dashboard.
How the data updates
Analytics is built from periodic syncs of your LinkedIn data, not a live feed.
- First load. If your LinkedIn URL is saved but nothing has been synced yet, LigoSocial fetches your data the first time you open Analytics. If no URL is saved, you are asked for your LinkedIn username first.
- Automatic sync. On plans that include it, data re-syncs on a schedule, and the header shows Next sync in. Otherwise you see an Auto-sync link explaining how to turn it on.
- Changing the date range recalculates the numbers for that range straight away.
LigoBrain
Open LigoBrain from the sidebar (or https://app.ligosocial.com/ligo-brain). Where Analytics measures your audience, LigoBrain measures how well LigoSocial knows you. The more it knows, the more your generated posts sound like you instead of generic AI.
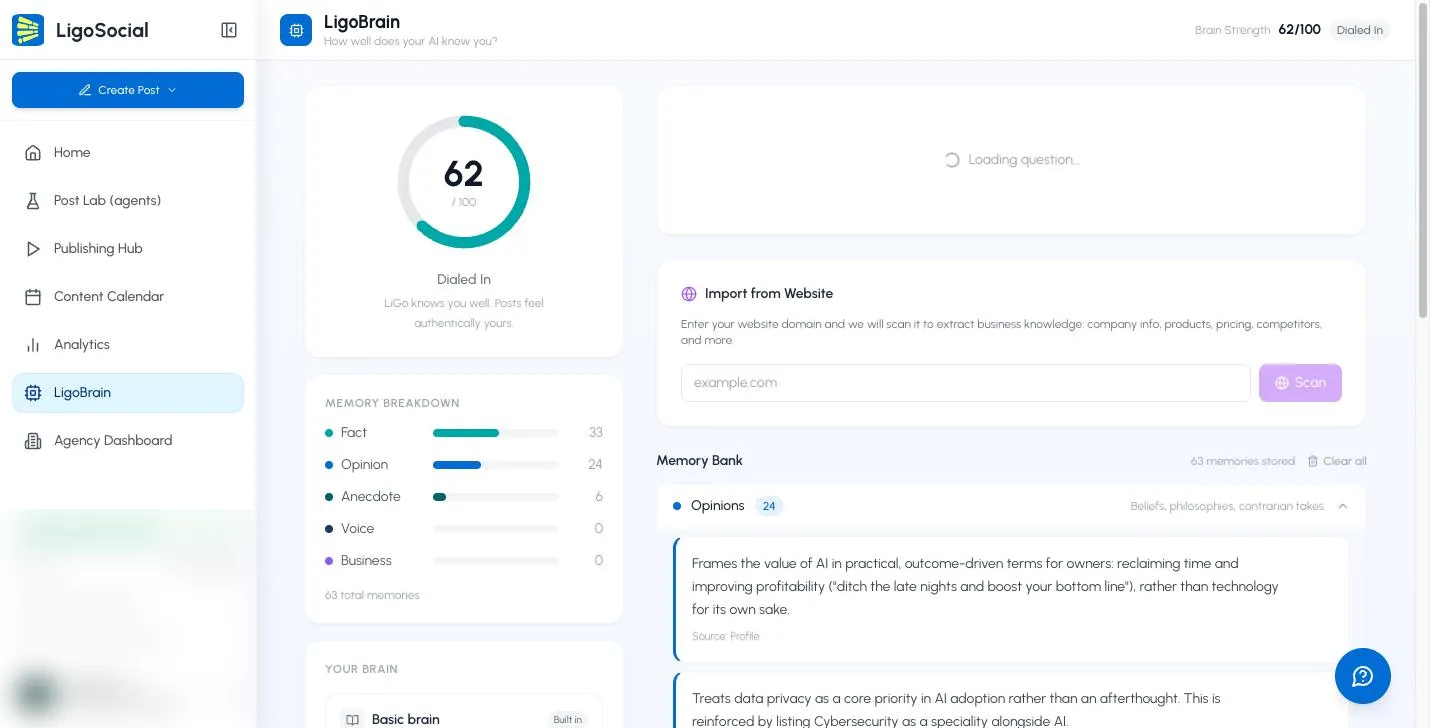
Brain Strength
A score from 0 to 100, also shown at the top right of the page, with a label:
- Blank Slate: LigoSocial does not know you yet, so posts will feel generic.
- Getting Started: a foundation exists. A few more memories make a noticeable difference.
- Coming Alive: posts are starting to sound like you.
- Dialed In: LigoSocial knows you well.
- Your AI Twin: it writes in your voice about as well as you do.
Memory Breakdown
Your brain is made of individual memories. The Memory Breakdown shows how many you have of each type:
- Fact: career details, roles, results and achievements
- Opinion: beliefs, philosophies and contrarian takes
- Anecdote: specific stories with context and an outcome
- Voice: how you communicate and your recurring style
- Business: company info, products, market and competitors
A balanced brain, especially with opinions and anecdotes, gives the most authentic posts.
Your brain: Basic or Advanced
Under Your brain you see what powers your posts:
- Basic brain (Built in): trained on your LinkedIn data.
- Locul: a desktop app that reads your own files, PDFs, notes and dictations on your computer and adds them to your brain. Click Connect Locul to set it up. When it is connected, LigoBrain shows Advanced active.
Brain questions
On plans that include them, LigoBrain asks you personal questions to fill gaps in your memory. Type your answer, or tap the microphone and speak it, then click Save to Brain. Click Skip to move on. The question card can show:
- Personalizing your questions...: a new batch is being prepared for you.
- All caught up!: you have answered everything available for now.
- Ready for new questions: you can generate a fresh batch.
Import from Website
Enter your domain under Import from Website and click Scan. LigoSocial reads the site and adds business memories (company info, products, competitors). When it finishes you see how many were added. Click Rescan after your site changes.
Memory Bank
The Memory Bank lists your stored memories by type. You can edit or delete any memory. Clear all deletes every memory and resets your Brain Strength. This cannot be undone.
Regenerate from LinkedIn data
The Regenerate from LinkedIn data link rebuilds your memories from your LinkedIn activity. You can run it once every 30 days. It runs in the background and takes a few minutes; the page refreshes when it is done.
FAQ
Why do my numbers look old? Check the sync status in the Analytics header. Data updates on the sync schedule, not in real time.
Why can't I select a longer date range? Longer ranges are available on plans that include them. Locked options show which plan unlocks them.
My LigoBrain score is low. What is the fastest way to raise it? Answer brain questions with concrete stories and opinions, run Import from Website if you have a business site, and add strong example posts to your content themes.
Related articles
Was this page helpful?